

Question: Please see below question: The Table below represents the tasks (20x) for a project. The labor column is in hours of effort. The labor rate
Please see below question:
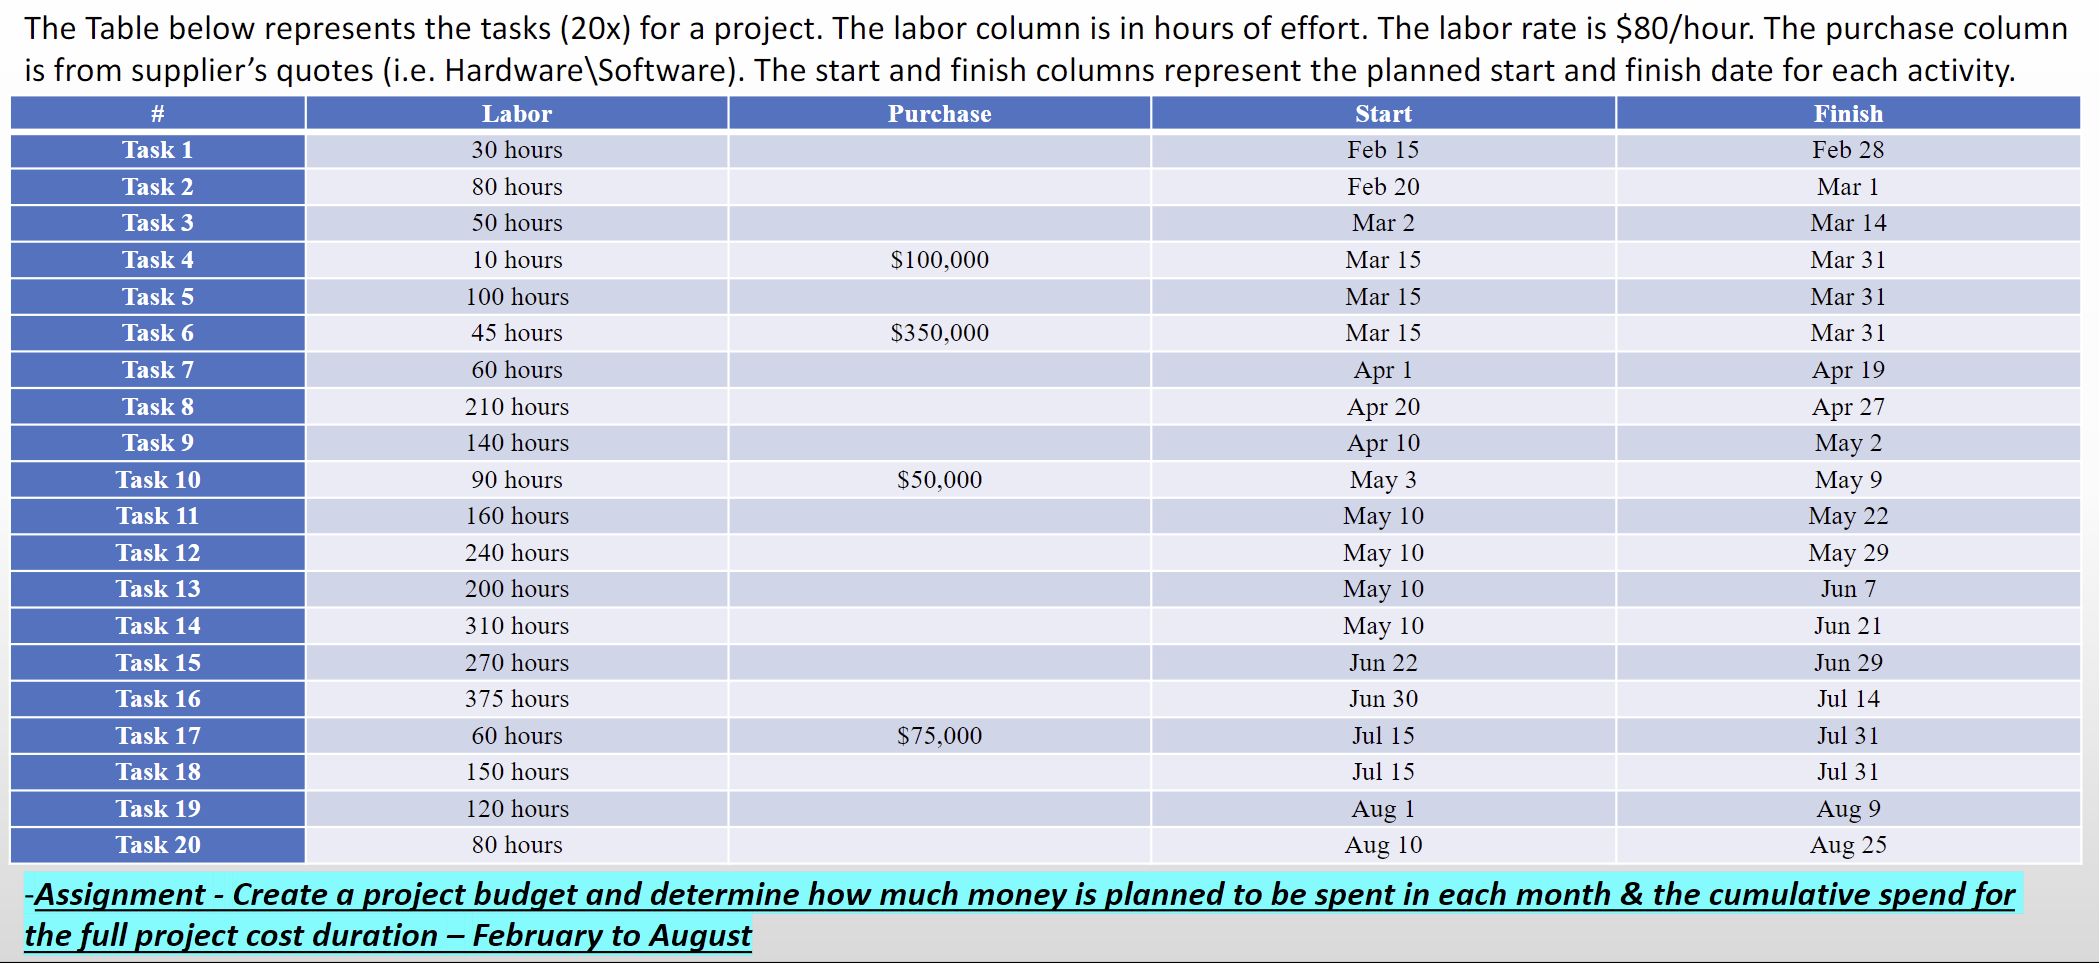
The Table below represents the tasks (20x) for a project. The labor column is in hours of effort. The labor rate is $80/hour. The purchase column is from supplier's quotes (i.e. Hardware\\Software). The start and finish columns represent the planned start and finish date for each activity. # Labor Purchase Start Finish Task 1 30 hours Feb 15 Feb 28 Task 2 80 hours Feb 20 Mar 1 Task 3 50 hours Mar 2 Mar 14 Task 4 10 hours $100,000 Mar 15 Mar 31 Task 5 100 hours Mar 15 Mar 31 Task 6 45 hours $350,000 Mar 15 Mar 31 Task 7 60 hours Apr 1 Apr 19 Task 8 210 hours Apr 20 Apr 27 Task 9 140 hours Apr 10 May 2 Task 10 90 hours $50,000 May 3 May 9 Task 11 160 hours May 10 May 22 Task 12 240 hours May 10 May 29 Task 13 200 hours May 10 Jun 7 Task 14 310 hours May 10 Jun 21 Task 15 270 hours Jun 22 Jun 29 Task 16 375 hours Jun 30 Jul 14 Task 17 60 hours $75,000 Jul 15 Jul 31 Task 18 150 hours Jul 15 Jul 31 Task 19 120 hours Aug 1 Aug 9 Task 20 80 hours Aug 10 Aug 25 Assignment - Create a project budget and determine how much money is planned to be spent in each month & the cumulative spend for the full project cost duration - February to August
Step by Step Solution
There are 3 Steps involved in it

Get step-by-step solutions from verified subject matter experts