

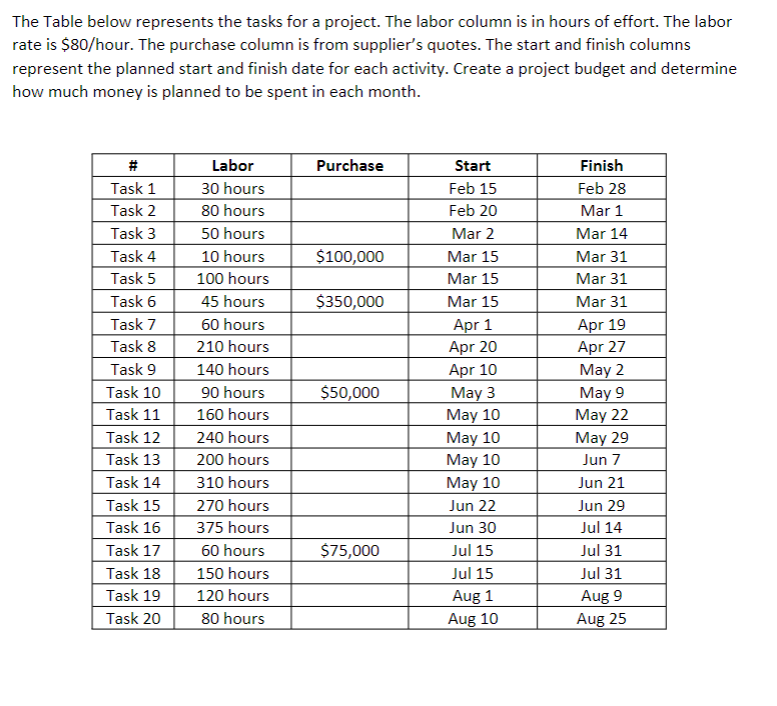
Question: The Table below represents the tasks for a project. The The Table below represents the tasks for a project. The labor column is in hours
The Table below represents the tasks for a project. The The Table below represents the tasks for a project. The labor column is in hours of effort. The labor rate is $ hour. The purchase column is from supplier's quotes. The start and finish columns represent the planned start and finish date for each activity. Create a project budget and determine how much money is planned to be spent in each month.
table#Labor,Purchase,Start,FinishTask hours,,Feb Feb Task hours,,Feb Mar Task hours,,Mar Mar Task hours,$Mar Mar Task hours,,Mar Mar Task hours,$Mar Mar Task hours,,Apr Apr Task hours,,Apr Apr Task hours,,Apr May Task hours,$May May Task hours,,May May Task hours,,May May Task hours,,May Jun Task hours,,May Jun Task hours,,Jun Jun Task hours,,Jun Jul Task hours,$Jul Jul Task hours,,Jul Jul Task hours,,Aug Aug Task hours,,Aug Aug labor column is in hours of effort. The labor
rate is $hour The purchase column is from suppliers quotes. The start and finish columns
represent the planned start and finish date for each activity. Create a project budget and determine
how much money is planned to be spent in each month.
# Labor Purchase Start Finish
Task hours Feb Feb
Task hours Feb Mar
Task hours Mar Mar
Task hours $ Mar Mar
Task hours Mar Mar
Task hours $ Mar Mar
Task hours Apr Apr
Task hours Apr Apr
Task hours Apr May
Task hours $ May May
Task hours May May
Task hours May May
Task hours May Jun
Task hours May Jun
Task hours Jun Jun
Task hours Jun Jul
Task hours $ Jul Jul
Task hours Jul Jul
Task hours Aug Aug
Task hours Aug Aug
Step by Step Solution
There are 3 Steps involved in it
1 Expert Approved Answer
Step: 1 Unlock

Question Has Been Solved by an Expert!
Get step-by-step solutions from verified subject matter experts
Step: 2 Unlock
Step: 3 Unlock