

Question: Please Show ALL Steps. Thank You. Problem 3. (18 points) The following data were collected for 12 months using a company's sales reports. The report
Please Show ALL Steps. Thank You.
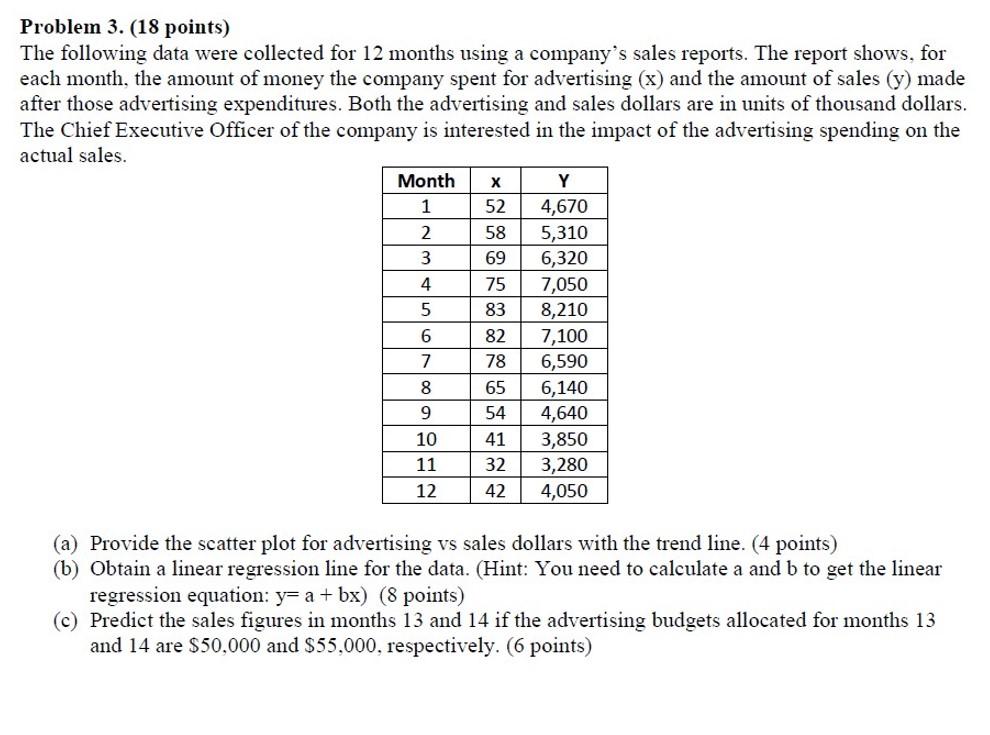
Problem 3. (18 points) The following data were collected for 12 months using a company's sales reports. The report shows, for each month, the amount of money the company spent for advertising (x) and the amount of sales (y) made after those advertising expenditures. Both the advertising and sales dollars are in units of thousand dollars. The Chief Executive Officer of the company is interested in the impact of the advertising spending on the actual sales. Month X Y 1 52 4,670 2 58 5,310 3 6,320 75 7,050 83 8,210 6 7,100 7 78 6,590 6,140 54 4,640 41 3,850 3,280 12 42 4,050 69 4 5 OOI OON 82 65 8 9 10 11 32 (a) Provide the scatter plot for advertising vs sales dollars with the trend line. (4 points) (b) Obtain a linear regression line for the data. (Hint: You need to calculate a and b to get the linear regression equation: y= a + bx) (8 points) (c) Predict the sales figures in months 13 and 14 if the advertising budgets allocated for months 13 and 14 are $50,000 and $55.000, respectively. 6 points)Step by Step Solution
There are 3 Steps involved in it
1 Expert Approved Answer
Step: 1 Unlock

Question Has Been Solved by an Expert!
Get step-by-step solutions from verified subject matter experts
Step: 2 Unlock
Step: 3 Unlock