

Question: Please show all work . I have the answer key, but I need to understand how we getting to the answer for both page 1
Please show all work. I have the answer key, but I need to understand how we getting to the answer for both page 1 and page 2. I need back ASAP as well, please and thank you!
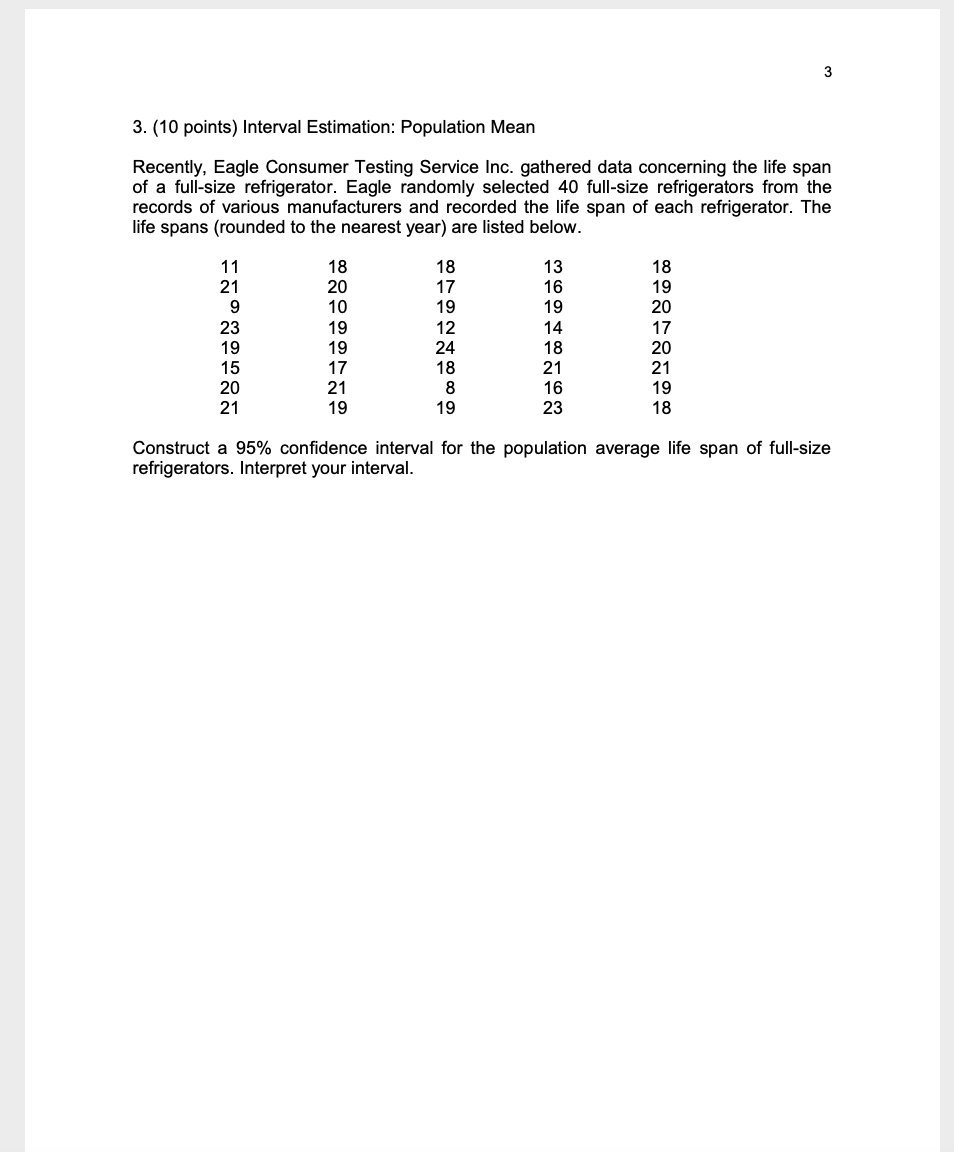
2. (25 points) Normal Distribution and Sampling Distribution After reviewing historical data in the form of a relative frequency histogram, the quality control manager at the Eagle Winery in Napa Valley, California believes that number of milliliters (ml) injected into the winery's standard size wine bottles (containing non- vintage red table wine) is normally distributed with mean 750 ml and standard deviation 4.5 ml. a. (5 points) Find the probability that a randomly selected standard size wine bottle that has been lled with wine will contain between 743 ml and 746 ml. b. {5 points) Find the probability that a randomly selected standard size wine bottle that has been lled with wine will contain between 748 ml and 752 ml. c. (5 points) Find the probability that a randomly selected standard size wine bottle that has been lled with wine will contain more than 759 ml. d. (5 points) Find the value of XO that makes the following statement true: 7.5% of standard size wine bottles lled by the Eagle Winery contain more than x0 milliliters. e. (5 points) Suppose that 50 lled standard size wine bottles are randomly selected and the number of milliliters of wine injected into a bottle follows the normal distribution specied by the quality control manager. What is the probability that the mean number of milliliters injected into these 50 bottles is more than 751.75 ml? List any assumptions that you make. 3. (10 points) Interval Estimation: Population Mean Recently, Eagle Consumer Testing Service Inc. gathered data concerning the life span of a full-size refrigerator. Eagle randome selected 40 full-size refrigerators from the records of various manufacturers and recorded the life span of each refrigerator. The life spans (rounded to the nearest year) are listed below. 11 18 18 13 18 21 20 17 18 19 9 1O 19 19 2O 23 19 12 14 17 19 19 24 18 20 15 17 18 21 21 2O 21 8 18 19 21 19 19 23 18 Construct a 95% condence interval for the population average life span of full-size refrigerators. Interpret your interval
Step by Step Solution
There are 3 Steps involved in it

Get step-by-step solutions from verified subject matter experts