

Question: please show all work: Sample Size n Mean Upper Lower Factor, A2 Range, D4 Range, D3 1.880 3.268 0.000 2 3 1.023 2.574 0.000 4
please show all work: 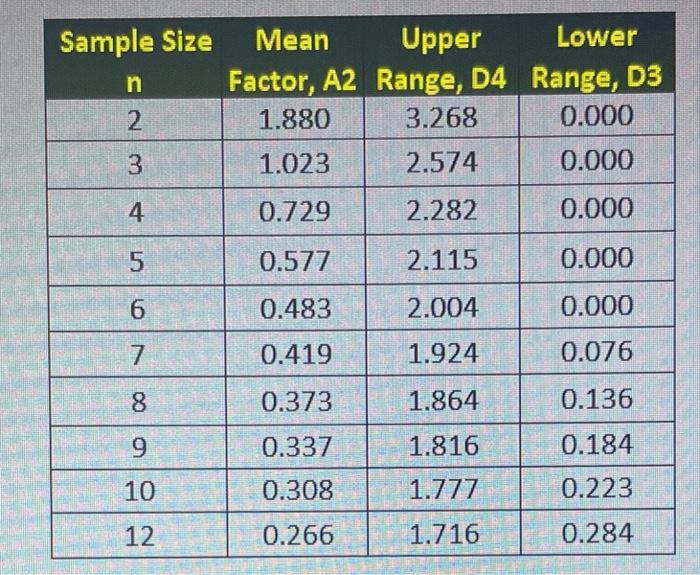
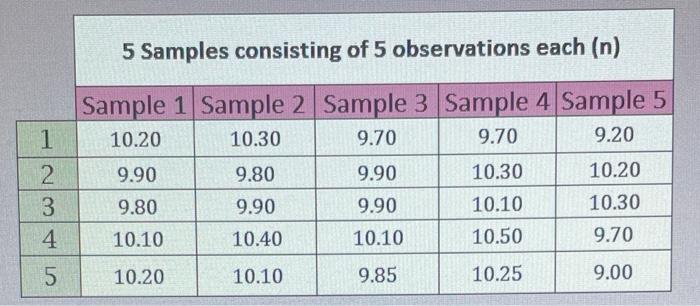
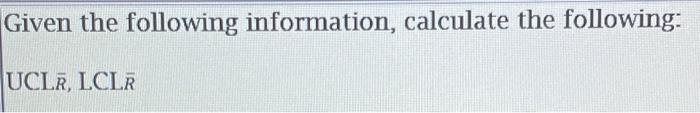
Sample Size n Mean Upper Lower Factor, A2 Range, D4 Range, D3 1.880 3.268 0.000 2 3 1.023 2.574 0.000 4 0.729 2.282 0.000 5 0.577 2.115 0.000 6 0.483 2.004 0.000 7 0.419 1.924 0.076 0.373 1.864 0.136 oool 0.337 1.816 0.184 10 0.308 1.777 0.223 12 0.266 1.716 0.284 5 Samples consisting of 5 observations each (n) Sample 1 Sample 2 Sample 3 Sample 4 Sample 5 10.20 10.30 9.70 9.70 9.20 1 9.90 9.80 9.90 10.30 10.20 2 3 4 9.80 9.90 10.30 | 9.90 10.40 10.10 10.50 10.10 10.10 9.70 5 10.20 10.10 9.85 10.25 9.00 Given the following information, calculate the following: UCLR, LCLR Step by Step Solution
There are 3 Steps involved in it
1 Expert Approved Answer
Step: 1 Unlock

Question Has Been Solved by an Expert!
Get step-by-step solutions from verified subject matter experts
Step: 2 Unlock
Step: 3 Unlock