

Question: Refer to table factors for computing control chart limit (3 sigma ) for this problem. Thirty -five samples size 7 each were taken from a
Refer to table factors for computing control chart limit (3 sigma ) for this problem.
Thirty -five samples size 7 each were taken from a fertilizer bag filling machine at marcos
Zenfal manufacturing Ltd. The results were:overall mean = 57.75 lb: Average range R = 1.64lb.
A)
for the given sample size,the control limits for 3 sigma X chart are:
Upper control limit ( UCLx) =......lb ( round your response to three decimal places)
Lower Control limit (LCLx)=......lb (round your response to three decimal places )
B) the control limits for the 3 sigma R chart are:
Upper control limit ( UCLr) =......lb ( round your response to three decimal places)
Lower Control limit (LCLr)=......lb (round your response to three decimal places )
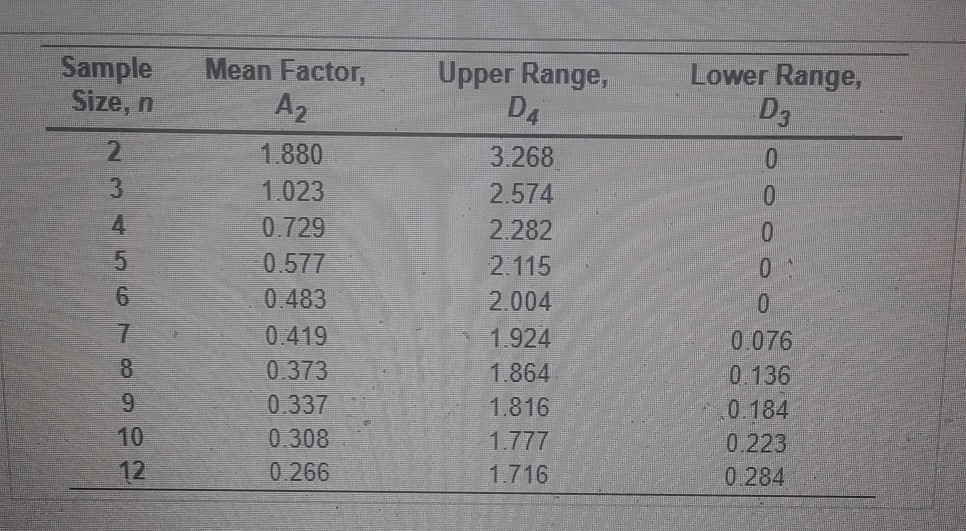
Sample Size, n Mean Factor, Lower Range, A2 D3 0 0 HOWN Upper Range, D4 3.268 2.574 2.282 2:115 2.004 1.924 1.864 1.816 1.777 1.716 1.880 1.023 0.729 0.577 0.483 0.419 0.373 0.337 0.308 0.266 0.076 0.136 0.184 0.223 0.284Step by Step Solution
There are 3 Steps involved in it

Get step-by-step solutions from verified subject matter experts