Question: please show all work. thanks! B second part choices: no, a moderate positive, a strong positive Mop and Broom Manufacturing has tracked the number of

please show all work. thanks!
B second part choices: no, a moderate positive, a strong positive please show all work. thanks! B second part
Mop and Broom Manufacturing has tracked the number of units sold of their most popular mop over the past 24 months. This is shown. Month Sales Month Sales Month Sales 1 248 9 308 17 371 NS 2 240 10 335 18 371 3 253 11 339 19 372 4 4 257 12 352 20 387 5 274 13 353 21 394 6 27 14 362 22 383 7 385 15 388 23 407 8 295 16 361 24 421 a. Develop a linear trendline for the data (Round your answers to 2 decimal places, eg,25.28.) Sales - (month) b. Compute a correlation coefficient for the data and evaluate the strength of the linear relationship. (Round your answer to 2 decimal places, the tolerance is +/-0.01.) Correlation coefficient is - It indicates linear relationship. (Use not rounded amounts to answer this question.) c. Using the linear trend line equation, develop a forecast for the next period.month 25. (Round your answer to 2 decimal places, the tolerance is +/-0.01. Do not round intermediate results used to achieve this answer.) Forecast for month 25

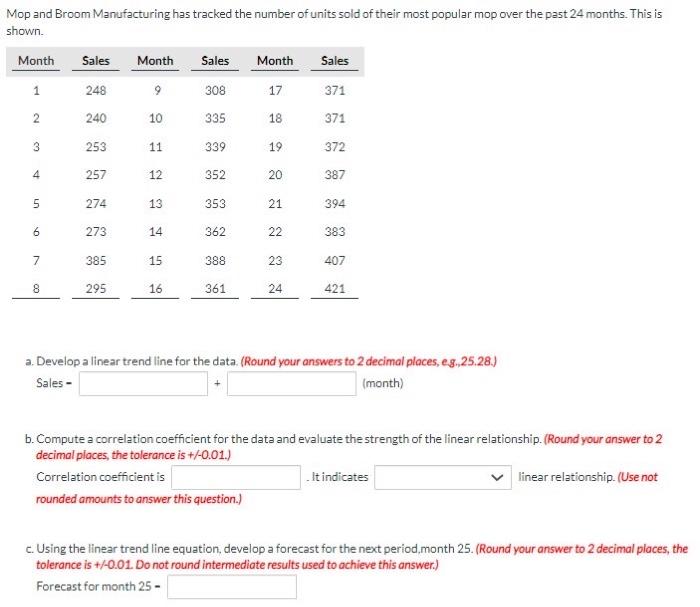
Step by Step Solution

There are 3 Steps involved in it

1 Expert Approved Answer
Step: 1 Unlock blur-text-image
Question Has Been Solved by an Expert!

Get step-by-step solutions from verified subject matter experts

Step: 2 Unlock
Step: 3 Unlock

Students Have Also Explored These Related General Management Questions!