

Question: Please show all work. Use the equation tool on Microsoft word to show clear work. Simplify answers down to their simplest form. And use this
Please show all work. Use the equation tool on Microsoft word to show clear work. Simplify answers down to their simplest form. And use this tool to graph and share the links instead of showing a picture:. Work will be rejected if it is clear and understandable for someone to read. Thanks
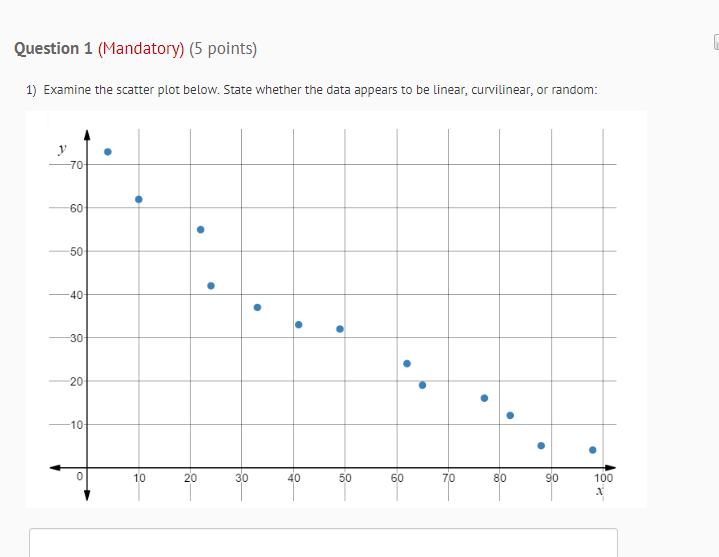


![someone to read. Thanks Question 1 [Mandatnry'] [5 points} 1] Examine The](https://dsd5zvtm8ll6.cloudfront.net/si.experts.images/questions/2024/10/6707fc6e451e9_6226707fc6e1e98e.jpg)
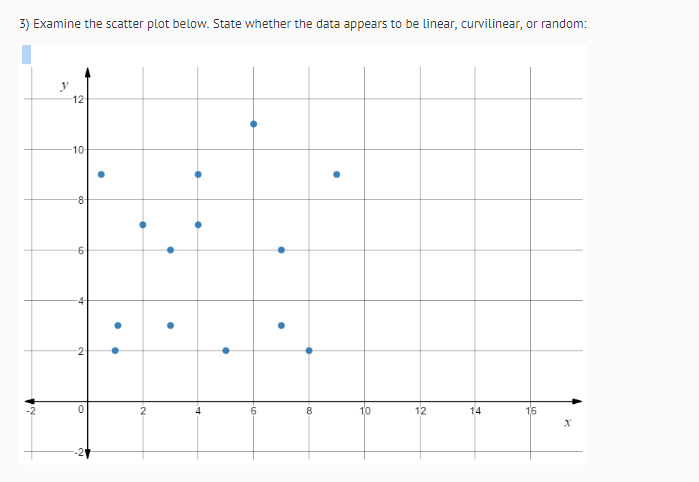
![er randem: 3] Examine the Scatter ant below. State whether the dam](https://dsd5zvtm8ll6.cloudfront.net/si.experts.images/questions/2024/10/6707fc6eda01c_6226707fc6ec45c1.jpg)

![this line appear to be a gent] model for the dale in](https://dsd5zvtm8ll6.cloudfront.net/si.experts.images/questions/2024/10/6707fc6fd4a3c_6236707fc6fbcf97.jpg)
![this scatter plot? Why or why not? 1D] U5ing the equation found](https://dsd5zvtm8ll6.cloudfront.net/si.experts.images/questions/2024/10/6707fc701e458_6246707fc7010561.jpg)
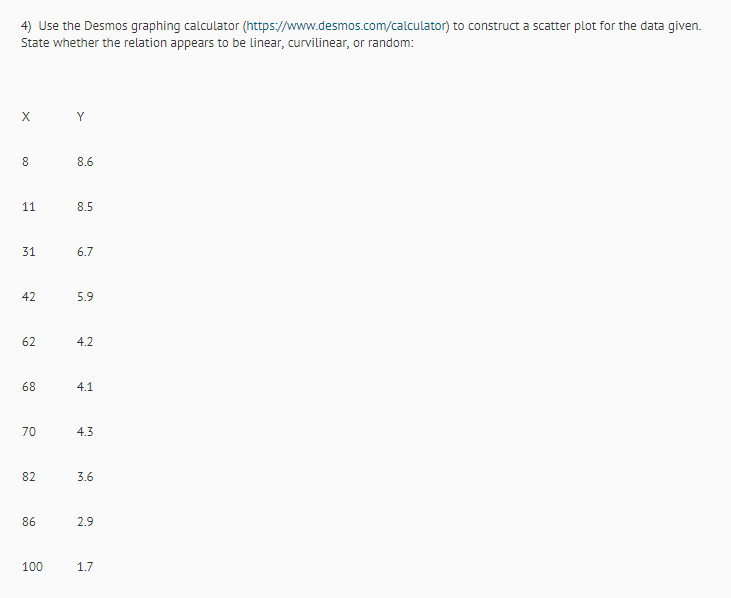
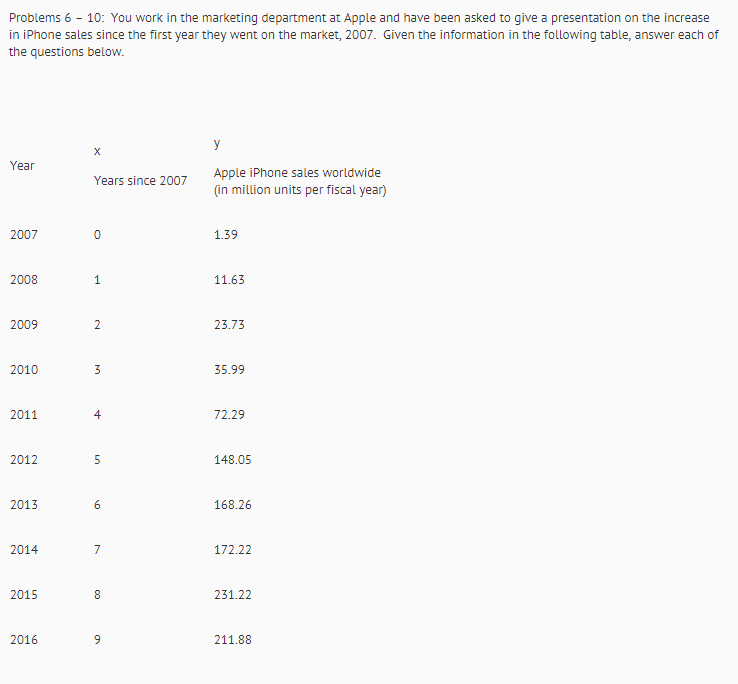
Question 1 [Mandatnry'] [5 points} 1] Examine The matter plat beLerw. Slate whether the data appear5 to be Linear, curvilinear, er randem: 3] Examine the Scatter ant below. State whether the dam appear to be linear, curviLI'near, or random: 9} Add the Line with equation found in #8 to your gmph of the scatter pLet Does this line appear to be a gent] model for the dale in this scatter plot? Why or why not? 1D] U5ing the equation found in #8, predict me num ber of iPthe saLes in the year 21320. 2} Examine the SLElttEr plat DELUW. Slate whether the data appears to he Linear, curvilinear, or random: 4} USE the DEl'I'IUE graphing talcuLater {httpsfnwwamesmncalcmamr} to cenStruct a Scatter pLet fer the data given. State memer the relation appears to be linear, eunriLinear, or random: X '1" E 8.6 11 8.5 31 6.2 42 5.9 62 4.2 68 4.1 2D 4.3 B2 3.6 86 2.9 1IIIIIEII 1.2 \fProblems 6 18: You work: in the marketing department at Apple and have been asked to give a praentation on the increase in iPhone SEIE since the rst 1,rear they:r went on the market, 2802. Given the information in the foLLowing taoLe, answer each of the questions beLow. x if irear Years since 200? Apple iii'honesales worldwide [In mllllon UHIE per fiscaLyear} 28-82 II) 1.59 2088 1 11.63 28-89 2 23.23 2818 3 35.99 2811 4 22.29 2812 5 148.85 2813 6 168.26 2814 2 122.22 2815 8 231.22 2816 9 211.88 Eu} Use the Desmes graphing caLculater |[ httpsjnwwdesrnoscemfcalcuLator} to construct a scatter plat for the data given from 200? to 2016 _ LabeL the axes ef the scatter plot to reflect the information given in the lame. 1"} Determine the slope of the line through the dam points given in 201)? and 2016. Write the shape in decimal form, rounding tn the I'IEEITESI hundredth of a millinnfyear. E} 1Ii'ii'rite an equation in slepe-ihtertept fenTI of the Line through the data points given in EDIE]? and 24316
Step by Step Solution
There are 3 Steps involved in it

Get step-by-step solutions from verified subject matter experts