

Question: please show all working out thanks! Question 1 Reconstruct the calculations to do with breakeven from Week 1 Workshop Exercise Question 1 parts a, b
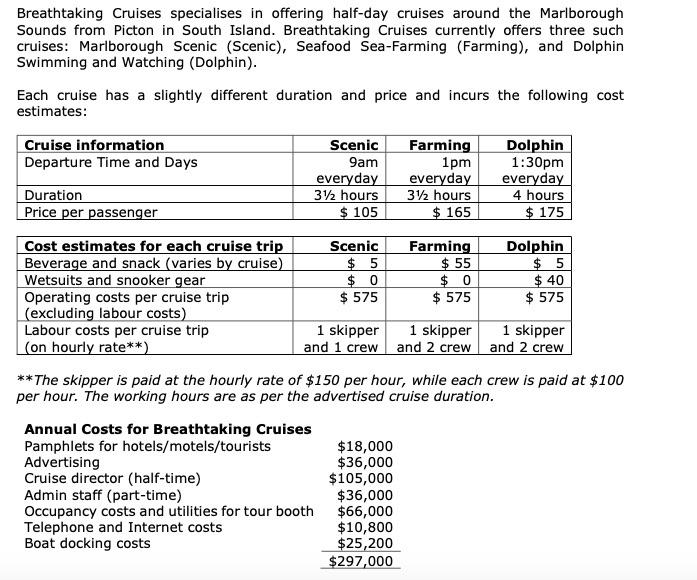
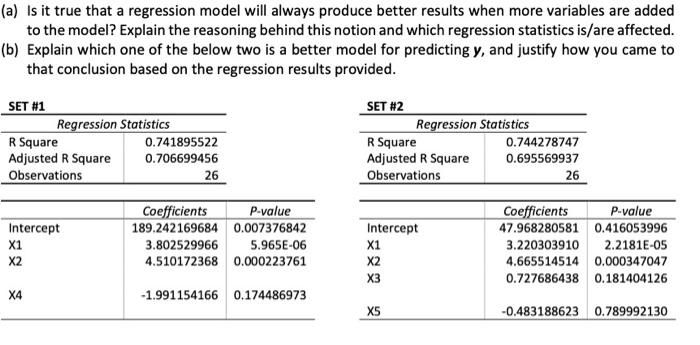
Breathtaking Cruises specialises in offering half-day cruises around the Marlborough Sounds from Picton in South Island. Breathtaking Cruises currently offers three such cruises: Marlborough Scenic (Scenic), Seafood Sea-Farming (Farming), and Dolphin Swimming and Watching (Dolphin). Each cruise has a slightly different duration and price and incurs the following cost estimates: Cruise information Scenic Farming Dolphin Departure Time and Days 9am 1pm 1:30pm everyday everyday everyday Duration 312 hours 312 hours 4 hours Price per passenger $ 105 $ 165 $ 175 Cost estimates for each cruise trip Scenic Farming Dolphin Beverage and snack (varies by cruise) $ 5 $ 55 $ 5 Wetsuits and snooker gear $ 0 $ 0 $ 40 Operating costs per cruise trip $ 575 $ 575 $ 575 (excluding labour costs) Labour costs per cruise trip 1 skipper 1 skipper 1 skipper (on hourly rate**) and 1 crew and 2 crew and 2 crew **The skipper is paid at the hourly rate of $150 per hour, while each crew is paid at $100 per hour. The working hours are as per the advertised cruise duration. Annual Costs for Breathtaking Cruises Pamphlets for hotels/motels/tourists $18,000 Advertising $36,000 Cruise director (half-time) $ 105,000 Admin staff (part-time) $36,000 Occupancy costs and utilities for tour booth $66,000 Telephone and Internet costs $10,800 Boat docking costs $25,200 $297,000 (a) Is it true that a regression model will always produce better results when more variables are added to the model? Explain the reasoning behind this notion and which regression statistics is/are affected. (b) Explain which one of the below two is a better model for predicting y, and justify how you came to that conclusion based on the regression results provided. SET #1 Regression Statistics R Square 0.741895522 Adjusted R Square 0.706699456 Observations 26 SET #2 Regression Statistics R Square 0.744278747 Adjusted R Square 0.695569937 Observations 26 Intercept X1 X2 Coefficients P-value 189.242169684 0.007376842 3.802529966 5.965E-06 4.510172368 0.000223761 Intercept X1 X2 X3 Coefficients P-value 47.968280581 0.416053996 3.220303910 2.2181E-05 4.665514514 0.000347047 0.727686438 0.181404126 X4 -1.991154166 0.174486973 XS -0.483188623 0.789992130 Breathtaking Cruises specialises in offering half-day cruises around the Marlborough Sounds from Picton in South Island. Breathtaking Cruises currently offers three such cruises: Marlborough Scenic (Scenic), Seafood Sea-Farming (Farming), and Dolphin Swimming and Watching (Dolphin). Each cruise has a slightly different duration and price and incurs the following cost estimates: Cruise information Scenic Farming Dolphin Departure Time and Days 9am 1pm 1:30pm everyday everyday everyday Duration 312 hours 312 hours 4 hours Price per passenger $ 105 $ 165 $ 175 Cost estimates for each cruise trip Scenic Farming Dolphin Beverage and snack (varies by cruise) $ 5 $ 55 $ 5 Wetsuits and snooker gear $ 0 $ 0 $ 40 Operating costs per cruise trip $ 575 $ 575 $ 575 (excluding labour costs) Labour costs per cruise trip 1 skipper 1 skipper 1 skipper (on hourly rate**) and 1 crew and 2 crew and 2 crew **The skipper is paid at the hourly rate of $150 per hour, while each crew is paid at $100 per hour. The working hours are as per the advertised cruise duration. Annual Costs for Breathtaking Cruises Pamphlets for hotels/motels/tourists $18,000 Advertising $36,000 Cruise director (half-time) $ 105,000 Admin staff (part-time) $36,000 Occupancy costs and utilities for tour booth $66,000 Telephone and Internet costs $10,800 Boat docking costs $25,200 $297,000 (a) Is it true that a regression model will always produce better results when more variables are added to the model? Explain the reasoning behind this notion and which regression statistics is/are affected. (b) Explain which one of the below two is a better model for predicting y, and justify how you came to that conclusion based on the regression results provided. SET #1 Regression Statistics R Square 0.741895522 Adjusted R Square 0.706699456 Observations 26 SET #2 Regression Statistics R Square 0.744278747 Adjusted R Square 0.695569937 Observations 26 Intercept X1 X2 Coefficients P-value 189.242169684 0.007376842 3.802529966 5.965E-06 4.510172368 0.000223761 Intercept X1 X2 X3 Coefficients P-value 47.968280581 0.416053996 3.220303910 2.2181E-05 4.665514514 0.000347047 0.727686438 0.181404126 X4 -1.991154166 0.174486973 XS -0.483188623 0.789992130
Step by Step Solution
There are 3 Steps involved in it

Get step-by-step solutions from verified subject matter experts