

Question: Please show all your work to help me better understand how to answer the question, and please answer all the questions in the picture. Thank

Please show all your work to help me better understand how to answer the question, and please answer all the questions in the picture. Thank you for your help and I will be rating highly!!!
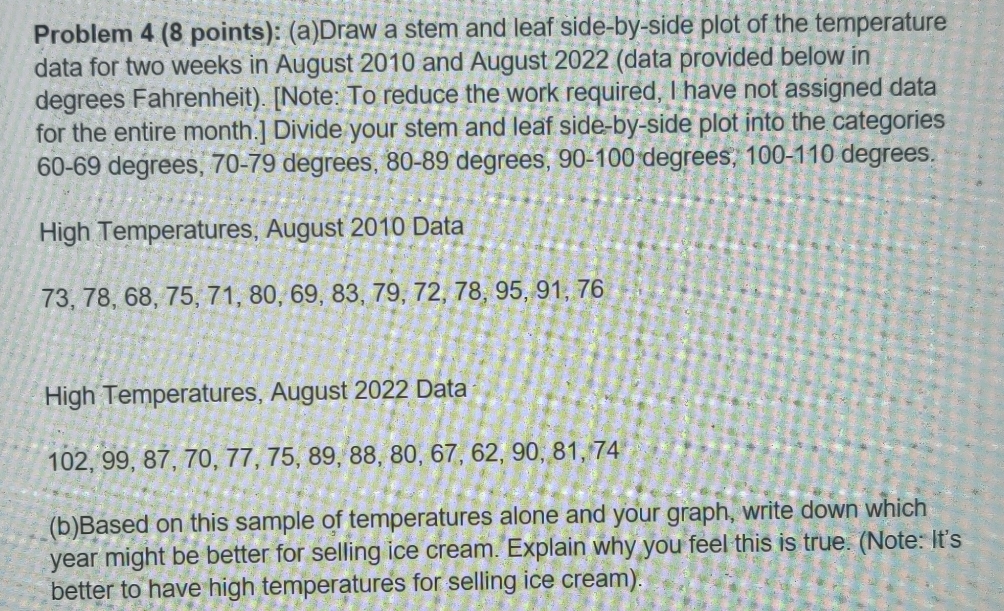
Problem 4 (8 points): (a)Draw a stem and leaf side-by-side plot of the temperature data for two weeks in August 2010 and August 2022 (data provided below in degrees Fahrenheit). [Note: To reduce the work required, I have not assigned data for the entire month.] Divide your stem and leaf side-by-side plot into the categories 60-69 degrees, 70-79 degrees, 80-89 degrees, 90-100 degrees, 100-110 degrees. High Temperatures, August 2010 Data 73, 78, 68, 75, 71, 80, 69, 83, 79, 72, 78, 95, 91, 76 High Temperatures, August 2022 Data 102, 99, 87, 70, 77, 75, 89, 88, 80, 67, 62, 90, 81, 74 (b)Based on this sample of temperatures alone and your graph, write down which year might be better for selling ice cream. Explain why you feel this is true. (Note: It's better to have high temperatures for selling ice cream)
Step by Step Solution
There are 3 Steps involved in it

Get step-by-step solutions from verified subject matter experts