

Question: Please show all your work to help me better understand how to answer the question. I will also be leaving the background information in the
Please show all your work to help me better understand how to answer the question. I will also be leaving the background information in the chat if you need it. Thank you for your help and I will be rating highly!!
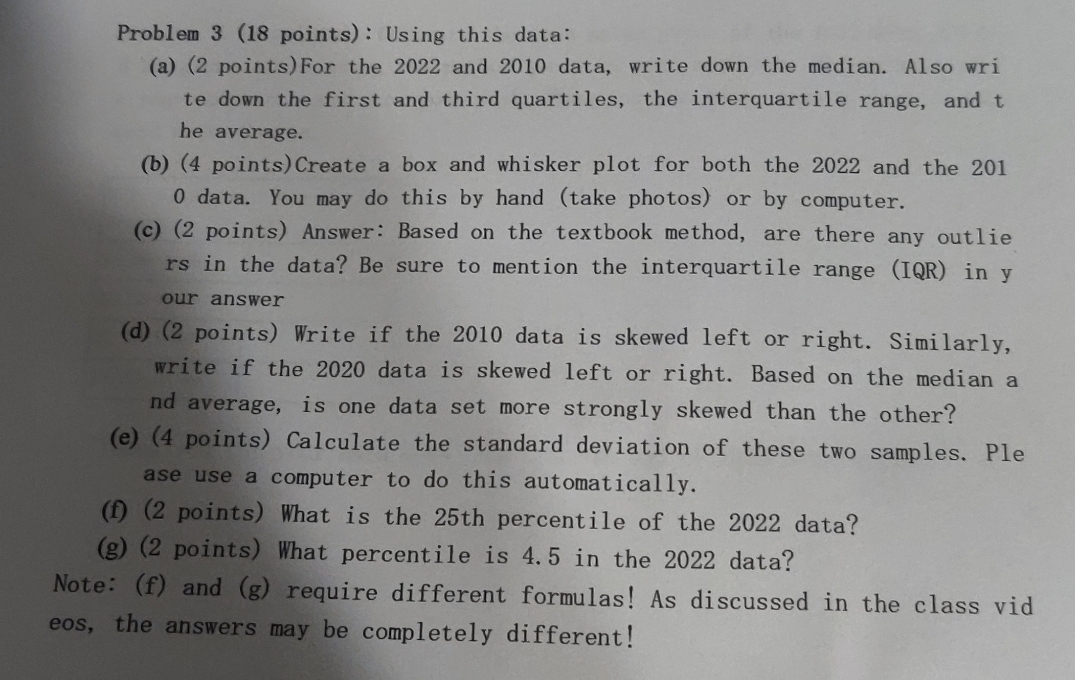
Problem 3 (18 points) : Using this data: (a) (2 points) For the 2022 and 2010 data, write down the median. Also wri te down the first and third quartiles, the interquartile range, and t he average. (b) (4 points) Create a box and whisker plot for both the 2022 and the 201 0 data. You may do this by hand (take photos) or by computer. (c) (2 points) Answer: Based on the textbook method, are there any outlie rs in the data? Be sure to mention the interquartile range (IQR) in y our answer (d) (2 points) Write if the 2010 data is skewed left or right. Similarly, write if the 2020 data is skewed left or right. Based on the median a nd average, is one data set more strongly skewed than the other? (e) (4 points) Calculate the standard deviation of these two samples. Ple ase use a computer to do this automatically. (f) (2 points) What is the 25th percentile of the 2022 data? (g) (2 points) What percentile is 4.5 in the 2022 data? Note: (f) and (g) require different formulas! As discussed in the class vid eos, the answers may be completely different
Step by Step Solution
There are 3 Steps involved in it

Get step-by-step solutions from verified subject matter experts