

Question: Please show all your work to help me better understand how to answer the question. I will also be leaving the background information in the
Please show all your work to help me better understand how to answer the question. I will also be leaving the background information in the chat if you need it. Thank you for your help and I will be rating highly!!
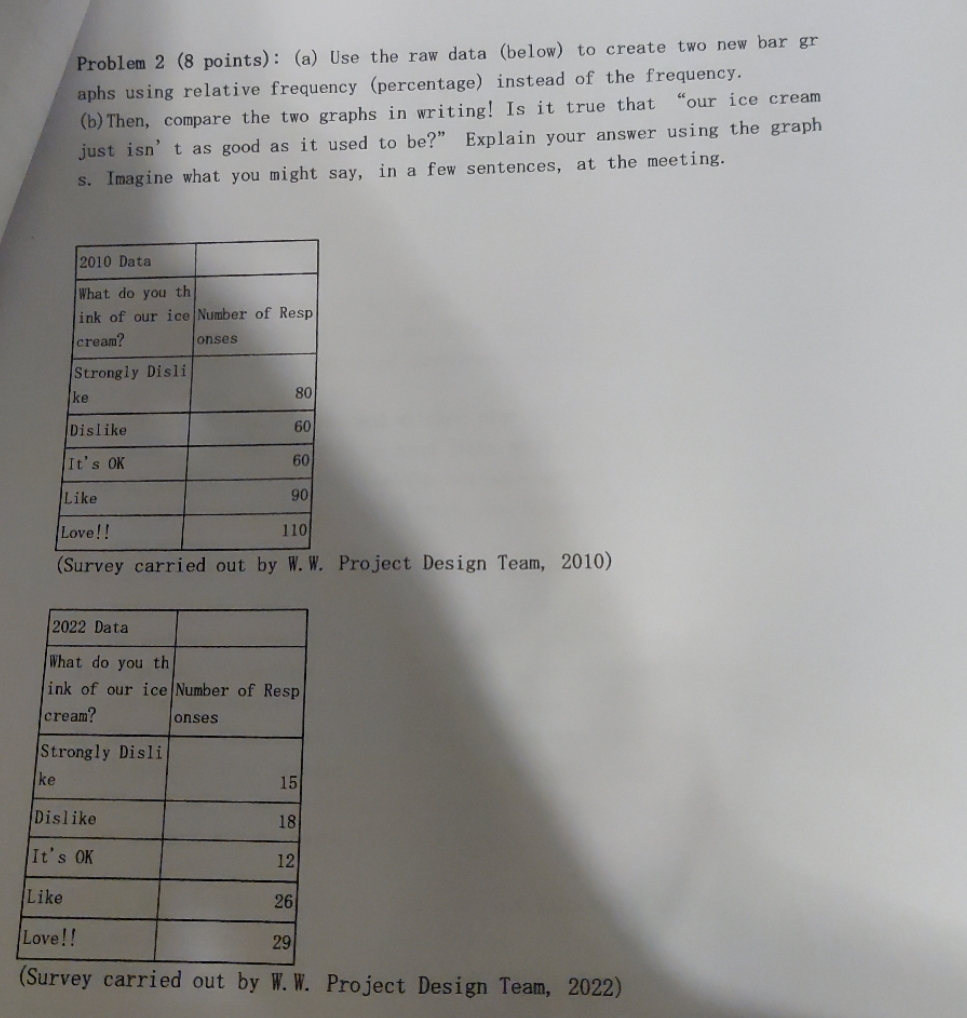
Problem 2 (8 points) : (a) Use the raw data (below) to create two new bar gr aphs using relative frequency (percentage) instead of the frequency. (b) Then, compare the two graphs in writing! Is it true that "our ice cream just isn't as good as it used to be?" Explain your answer using the graph s. Imagine what you might say, in a few sentences, at the meeting. 2010 Data What do you th ink of our ice Number of Resp cream? onses Strongly Disli ke 80 Dislike 60 It's OK 60 Like 90 Love! ! 110 Survey carried out by W. W. Project Design Team, 2010) 2022 Data What do you th ink of our ice Number of Resp cream? onses Strongly Disli ke 15 Dislike 18 It's OK 12 Like 26 Love! ! 29 (Survey carried out by W. W. Project Design Team, 2022)
Step by Step Solution
There are 3 Steps involved in it

Get step-by-step solutions from verified subject matter experts