Question: Please show answer in excel, thank you! Sample # 2 3 6 7 8 9 10 11 12 13 14 15 16 1 7.01 7.22

Please show answer in excel, thank you!Please show answer in excel, thank you! Sample #

Sample # 2 3 6 7 8 9 10 11 12 13 14 15 16 1 7.01 7.22 6.97 7.13 7.13 7.10 7.25 7.17 7.17 7.24 6.98 7.20 7.04 7.03 7.13 7.11 2 7.00 7.20 7.09 7.17 7.06 6.95 7.08 7.10 6.98 7.17 7.07 7.09 7.14 7.03 7.14 7.15 Observation # 3 4 7.09 7.02 7.17 7.07 7.11 7.15 7.24 7.07 7.10 7.29 7.03 7.21 7.03 7.08 7.02 7.18 7.15 7.11 7.04 7.06 7.21 7.28 7.07 6.93 7.09 7.15 7.15 7.06 7.11 7.07 7.02 7.13 5 7.12 7.02 7.05 7.14 7.11 7.13 7.00 6.96 7.05 7.14 7.04 6.99 7.19 7.09 7.04 7.18 6 7.20 6.99 6.98 7.00 7.05 7.04 7.25 7.05 7.16 7.25 7.10 7.20 7.09 7.16 7.13 7.12 7 7.00 7.01 7.17 7.16 7.10 7.15 7.13 6.99 7.16 7.02 7.00 6.96 7.21 7.20 7.00 7.15 Part B: Interpreting Control Charts (Data for these questions is given in the spreadsheet) 1) In Part B of the spreadsheet, there are 4 data sets. Each data set represents 16 samples of size 10 observations. From each sample, X-bar and R were calculated and then plotted on the appropriate control chart. You are to evaluate each data set for out of control conditions. Specifically, you should: State whether the process seems to be in control or out of control If you believe it is out of control, you should clearly state why (e.g. x-bar chart has sample 12 below the lower control limit). If you believe it is out of control, you should clearly state the nature of the out of control condition (e.g. process mean has shifted lower)

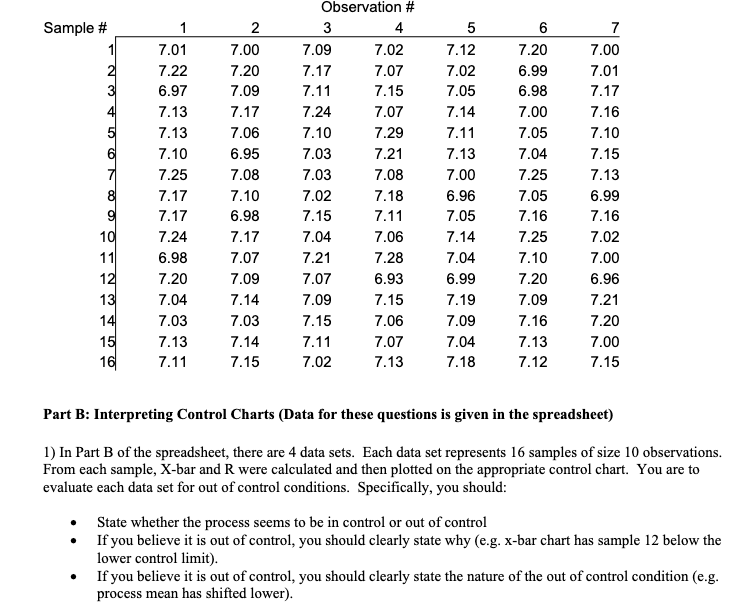
Step by Step Solution

There are 3 Steps involved in it

1 Expert Approved Answer
Step: 1 Unlock blur-text-image
Question Has Been Solved by an Expert!

Get step-by-step solutions from verified subject matter experts

Step: 2 Unlock
Step: 3 Unlock

Students Have Also Explored These Related General Management Questions!