

Question: Please show as much work as possible . Also please explain any values used from z tables or t-tables used . Thank you . And
Please show as much work as possible . Also please explain any values used from z tables or t-tables used . Thank you . And also anything you might think is useful to know for someone just getting started
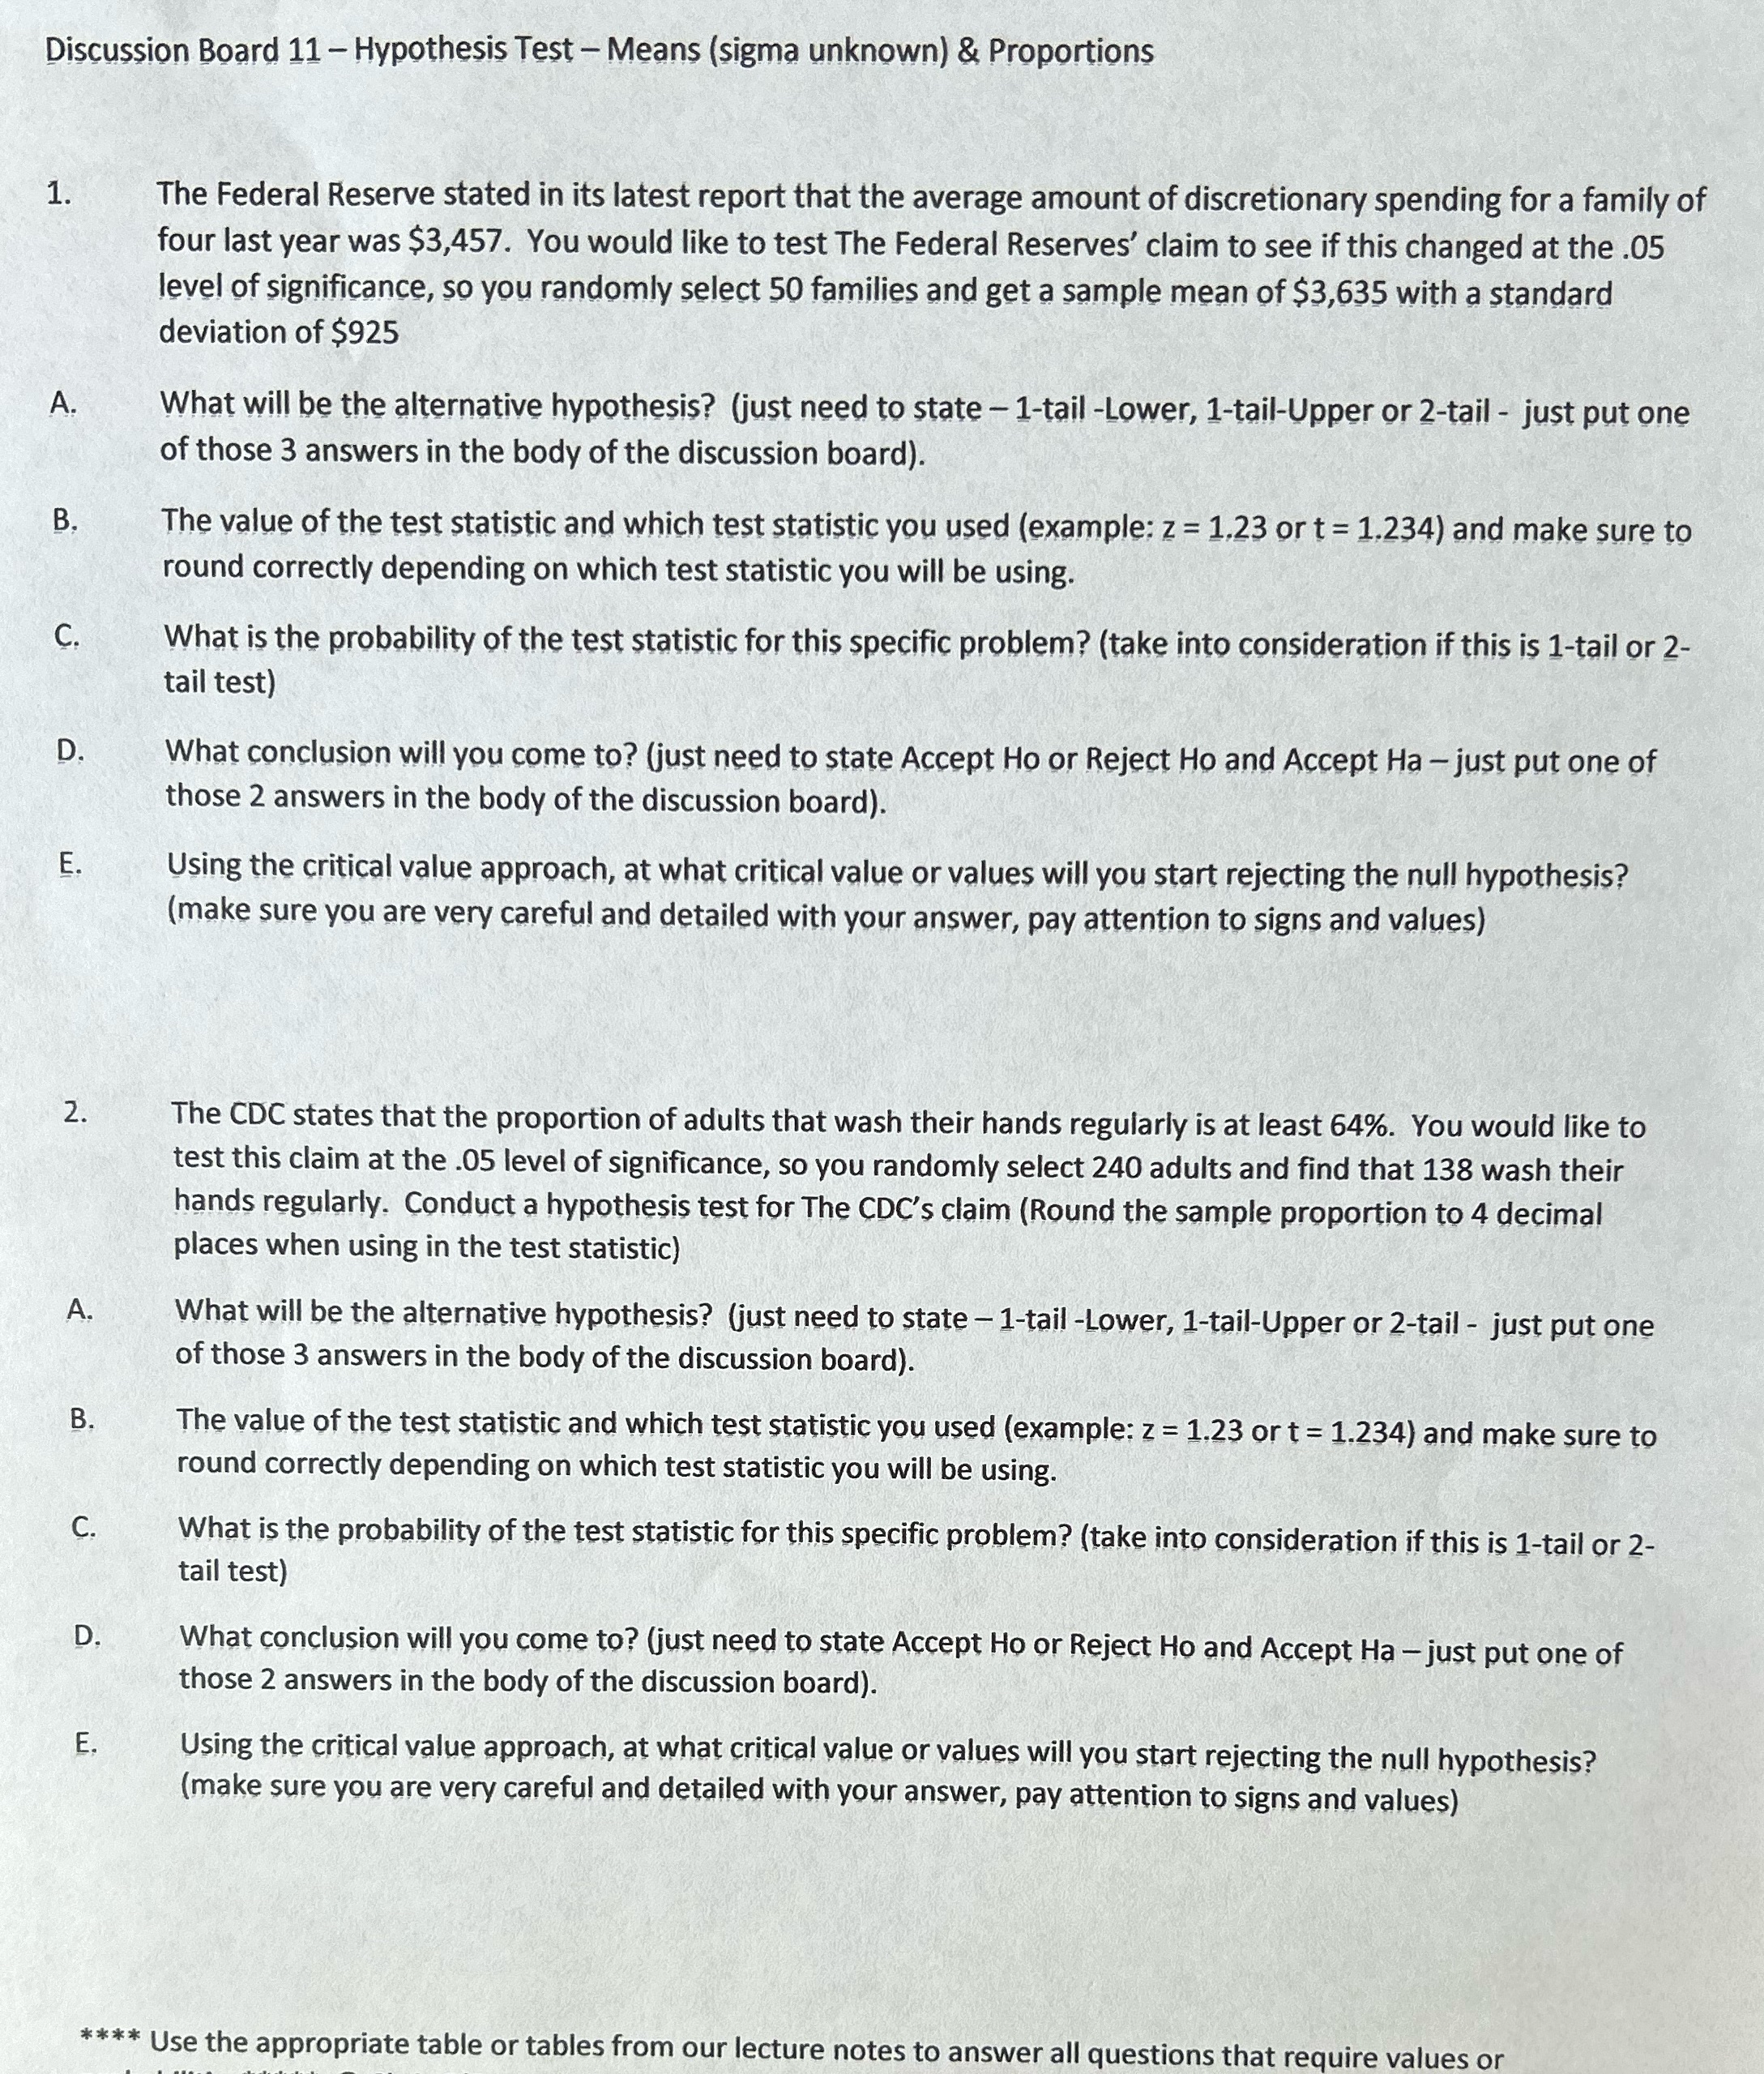
Discussion Board 11 Hypothesis Test Means (sigma unknown) & Proportions 1 The Federal Reserve stated in its latest report that the average amount of discretionary spending for a family of four last year was $3,457. You would like to test The Federal Reserves' claim to see if this changed at the .05 level of significance, so you randomly select 50 families and get a sample mean of $3,635 with a standard deviation of $925 A. What will be the alternative hypothesis? (just need to state 1-tail -Lower, 1-tail-Upper or 2-tail - just put one of those 3 answers in the body of the discussion board). B. The value of the test statistic and which test statistic you used (example: z = 1.23 or t = 1.234) and make sure to round correctly depending on which test statistic you will be using. G, What is the probability of the test statistic for this specific problem? (take into consideration if this is 1-tail or 2- tail test) D. What conclusion will you come to? (just need to state Accept Ho or Reject Ho and Accept Ha just put one of those 2 answers in the body of the discussion board). E. Using the critical value approach, at what critical value or values will you start rejecting the null hypothesis? (make sure you are very careful and detailed with your answer, pay attention to signs and values) 24 The CDC states that the proportion of adults that wash their hands regularly is at least 64%. You would like to test this claim at the .05 level of significance, so you randomly select 240 adults and find that 138 wash their hands regularly. Conduct a hypothesis test for The CDC's claim (Round the sample proportion to 4 decimal places when using in the test statistic) A. What will be the alternative hypothesis? (just need to state 1-tail -Lower, 1-tail-Upper or 2-tail - just put one of those 3 answers in the body of the discussion board). B. The value of the test statistic and which test statistic you used (example; z=1.23 or t = 1.234) and make sure to round correctly depending on which test statistic you will be using. C. What is the probability of the test statistic for this specific problem? (take into consideration if this is 1-tail or 2- tail test) D. What conclusion will you come to? (just need to state Accept Ho or Reject Ho and Accept Ha just put one of those 2 answers in the body of the discussion board). E. Using the critical value approach, at what critical value or values will you start rejecting the null hypothesis? (make sure you are very careful and detailed with your answer, pay attention to signs and values) **** Use the appropriate table or tables from our lecture notes to answer all questions that require values or
Step by Step Solution
There are 3 Steps involved in it

Get step-by-step solutions from verified subject matter experts