

Question: please show excel functions used :) face value $100 current date 12/31/19 coupon freq. semiannually bond yield AZY TSR LKJ ONM WAV JQU coupon maturity
 please show excel functions used :)
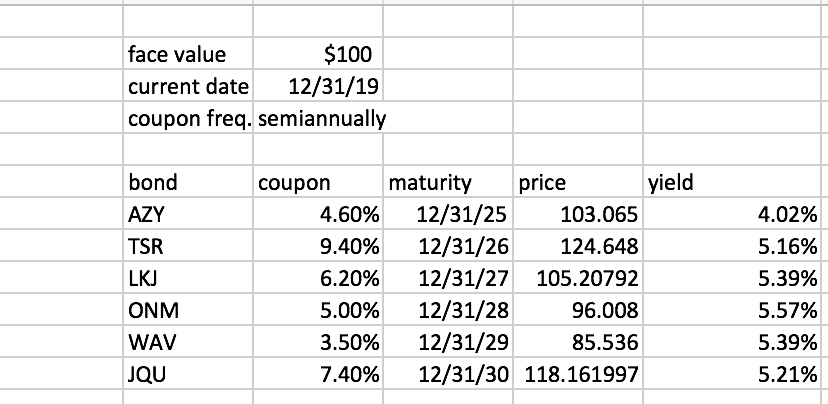
face value $100 current date 12/31/19 coupon freq. semiannually bond yield AZY TSR LKJ ONM WAV JQU coupon maturity price 4.60% 12/31/25 103.065 9.40% 12/31/26 124.648 6.20% 12/31/27 105.20792 5.00% 12/31/28 96.008 3.50% 12/31/29 85.536 7.40% 12/31/30 118.161997 4.02% 5.16% 5.39% 5.57% 5.39% 5.21% 2. Once you have filled in the missing values, use the spreadsheet graphing function to draw the yield curve represented by the information provided in the table. Discuss and interpret the term structure of these rates. Does the slope of the yield curve suggest the direction interest rates will move during the six- year period from 2025 to 2030? Explain your answer. face value $100 current date 12/31/19 coupon freq. semiannually bond yield AZY TSR LKJ ONM WAV JQU coupon maturity price 4.60% 12/31/25 103.065 9.40% 12/31/26 124.648 6.20% 12/31/27 105.20792 5.00% 12/31/28 96.008 3.50% 12/31/29 85.536 7.40% 12/31/30 118.161997 4.02% 5.16% 5.39% 5.57% 5.39% 5.21% 2. Once you have filled in the missing values, use the spreadsheet graphing function to draw the yield curve represented by the information provided in the table. Discuss and interpret the term structure of these rates. Does the slope of the yield curve suggest the direction interest rates will move during the six- year period from 2025 to 2030? Explain your
Step by Step Solution
There are 3 Steps involved in it

Get step-by-step solutions from verified subject matter experts