

Question: PLEASE SHOW FORMULAS Given Dec-14 Dec-15 12 211 05 13368.00 9.755.00 2.777.00 170400 2078.00 TCM Petroleum Sales Cost of Goods Sold Gross Profit Selling. General,
 PLEASE SHOW FORMULAS
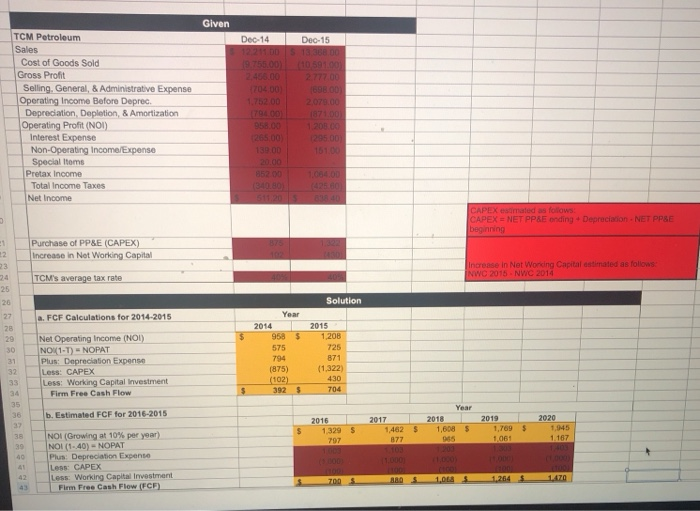
 Given Dec-14 Dec-15 12 211 05 13368.00 9.755.00 2.777.00 170400 2078.00 TCM Petroleum Sales Cost of Goods Sold Gross Profit Selling. General, & Administrative Expense Operating Income Before Deprec Depreciation, Depletion, & Amortization Operating Profit (NOI) Interest Expense Non-Operating Income/Expense Special Items Pretax Income Total Income Taxes Net Income 958.00 265.00 1295.00 340.80 511, 2015 CAPEX estimated as follows: CAPEX = NET PP&E onding Depreciation NET PPSE beginning Purchase of PP&E (CAPEX) Increase in Not Working Capital 23 Increase in Net Wondng Capital estimated as follows: INWO 2015 NWC 2014 TCM's average tax rate Solution a. FCF Calculations for 2014-2015 Year 25 20 27 28 29 30 31 32 33 34 2014 9585 575 794 Net Operating Income (NOI) NOK1-T) - NOPAT Plus: Depreciation Expense Less: CAPEX Less: Working Capital Investment Firm Free Cash Flow 2015 1,200 725 871 (1.322) 430 704 (875) (102) 3925 $ b. Estimated FCF for 2016-2015 36 37 38 39 2016 1.329 797 2017 1,4625 Year 2018 1,600 955 $ 2019 1,709 9 1,061 2020 1.045 1.167 NOI (Growing at 10% per year) NOI (1.40) - NOPAT Plus: Depreciation Expono Less: CAPEX Less Working Capital Investment Firm Free Cash Flow (FCE) 700 S 880S 1.08 5 1.264 $ 1.470
Step by Step Solution
There are 3 Steps involved in it

Get step-by-step solutions from verified subject matter experts