

Question: please show formulas so i can better understand this and also put answers in graph form. thank you! :) 8.8. Weekly demand for an item
please show formulas so i can better understand this and also put answers in graph form. thank you! :) 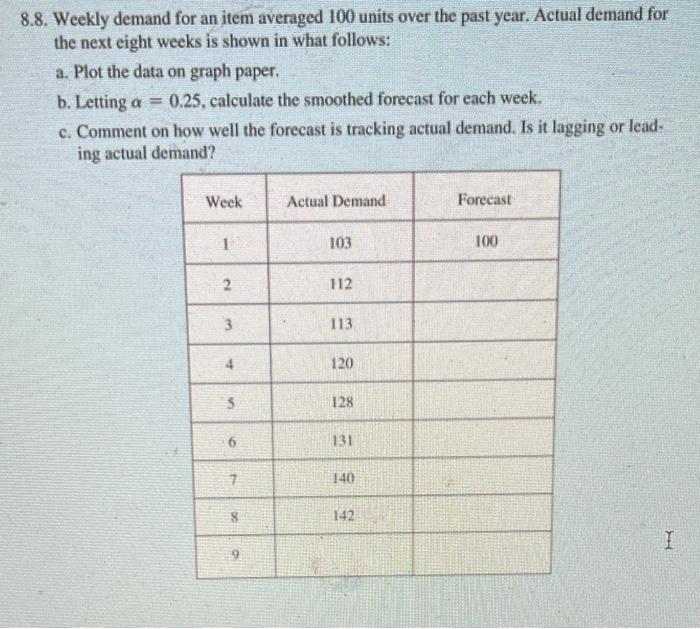
8.8. Weekly demand for an item averaged 100 units over the past year. Actual demand for the next eight weeks is shown in what follows: a. Plot the data on graph paper. b. Letting a = 0.25, calculate the smoothed forecast for each week. c. Comment on how well the forecast is tracking actual demand. Is it lagging or lead- ing actual demand? Week Actual Demand Forecast 1 103 100 2 112 3 113 4 120 5 128 6 131 7 140 8 142 I 9
Step by Step Solution
There are 3 Steps involved in it
1 Expert Approved Answer
Step: 1 Unlock

Question Has Been Solved by an Expert!
Get step-by-step solutions from verified subject matter experts
Step: 2 Unlock
Step: 3 Unlock