

Question: Please show how to solve in excel! Will give thumbs up! Nancy Cummins was feeling a bit overwhelmed the last few weeks. After having worked
Please show how to solve in excel! Will give thumbs up!
Nancy Cummins was feeling a bit overwhelmed the last few weeks. After having
worked at Pleasure Craft (PC) Inc. for only a year, she was selected to be the team
leader for a very important project. The company was seriously considering
expanding into the production of either outboard motors or front-end loaders, and
had asked Cumminss team to prepare a detailed financial analysis of each project
and to recommend whether one or both projects should be pursued. Determining
initial costs, estimating future cash flows and calculating costs of capital were all
very new to Cummins, but with a skilled group of professionals on the team, she
strongly felt that together they could make the right decision.
BACKGROUND
PC, a manufacturer of snowmobiles and personal watercraft (PW), had been
operating in Canada for more than 40 years. It manufactured its snowmobiles in
Winnipeg, Manitoba, and its PW in Kelowna, British Columbia, and sold them
both domestically and internationally. The company had been very successful
financially, but the board of directors felt that these two segments were maturing
and did not offer strong potential for growth. Also, the company was worried
about the future prospects of PW, as many municipalities were beginning to limit
the use of PW due to noise complaints, safety concerns and riverbank erosion.
PC was considering an expansion of its business. One option was to manufacture
small, front-end loaders, which would be sold primarily to construction companies,
farmers and ranchers, the military and municipal governments. Although the
company felt that this new business would draw upon its existing strengths in
small-engine manufacturing, it would be selling to a market in which it had no
sales experience.
A second option was to manufacture outboard motors. This expansion would
allow the company to remain in the leisure craft market and utilize its established
selling network.
Expansion into front-end loaders or outboard motors would be an expensive
undertaking necessitating the construction of a new manufacturing plant.
Cummins had been assigned as the team leader of a group of engineers,
accountants and marketers responsible for investigating these new projects. The
team had been named Badger after the ferocious North American mammal,
which was representative of the companys outdoor focus.
Undertaking both projects was a possibility, but it would tax the companys capital
budget and put great pressure on the companys management.
FRONT-END LOADER PROJECT
PC would have to build a new factory to manufacture front-end loaders. The
facility would have capacity to produce 10,000 units per year. The cost of the land
would be $1.5 million, and the building would cost $5.5 million. Equipment
costing $10 million would also be needed. It was expected that the building and
equipment would be either worn out or obsolete within 15 years, at which time the
company would reconsider its options relating to this product line. It was
estimated that, at the end of the projects life, the land would be worth $3 million,
the building $500,000 and the equipment $400,000 in todays dollars. The
building and equipment would have minimal salvage value due to their highly
specialized nature. The building would be subject to a capital cost allowance
(CCA) rate of 10 per cent and the equipment, a CCA rate of 30 per cent. For tax
purposes, the building was amortized separately in its own pool. The equipment
was a busy class with numerous asset sales and purchases throughout the year.
In addition to property, plant and equipment, additional net working capital
(NWC) would be required, which would vary with sales. The NWC turnover ratio
for this new operation was expected to be 6:1.
Sales were estimated to be 2,850 units in the first year, but were expected to grow
at approximately 20 per cent per year for the first five years before leveling out to
three per cent growth as the company reached maximum market penetration. Sales
of front-end loaders were seasonal and were expected to follow the following
pattern:
January March 20%
April June 40%
July September 30%
October December 10%
Construction companies, farmers and ranchers would purchase their units through
local heavy equipment retailers, who would buy the units from PC at a list price of
$21,000. In addition to selling to retailers, PCs sales force would sell directly to
its military and municipal clients, who would receive a 15 per cent discount on the
list price. PC expected sales to its military and municipal clients to be 50 per cent
of total sales, but to fall to 25 per cent in Year 4.
The cost of goods sold was expected to be $18,650 per unit. Non-traceable factory
costs were expected to be $850,000 per year. An additional $250,000 in annual
administration costs related to the new plant would be incurred at head office.
Selling this new product would demand the hiring of a national sales manager at
$110,000 per year and two regional sales managers (Eastern and Western Canada)
at $85,000 each per year, who would be located in the corporate sales office and
not at the plant. It was felt that 10 additional sales people at a base salary of
$35,000 would be needed to sell this new product. A commission equal to two per
cent of unit gross profit would be received by the national sales manager, who
would distribute it to the two regional sales managers and the individual sales
persons depending on how well they met their quotas. To encourage sales to
higher margin retail clients, the commission was based on the gross profit margin
of the units sold.
Although difficult to estimate, it was expected that the company would have
enough market power to raise prices by the inflation rate each year. All costs were
also expected to increase by the inflation rate, which was estimated to average two
per cent per year over the life of the project. Cash flows other than sales and costs
of goods sold occurred uniformly throughout the year.
OUTBOARD MOTOR PROJECT
The new factory to build outboard motors would last approximately 20 years and
could produce approximately 30,000 units per year. The land would cost $1.2
million and the building would cost $6.25 million. Production equipment worth
$7.5 million would also have to be acquired. It was estimated that, in 20 years, the
land would be worth $2.5 million and the building $1.25 million in todays dollars.
The equipment would have a negligible salvage value. The building was subject to
a CCA rate of 10 per cent and the equipment, a rate of 30 per cent. For tax
purposes, the building was amortized separately in its own pool.
Additional NWC would be required to support this project. The NWC turnover
ratio for this new operation was expected to be 6:1.
Sales were estimated to be $10,000 the first year, but would grow at 10 per cent a
year until the end of Year 10 at which time, sales were expected to level out. Sales
would then grow at three per cent a year reflecting general growth in the industry.
Major increments in capacity were not economical due to the nature of the
production process, but the company felt production could be increased to as much
as 35,000 units with improvements in work methods. Sales of outboard motors
were seasonal and were expected to follow the pattern below:
January March 10%
April June 60%
July September 20%
October December 10%
Outboard motors would be sold through the same retailers that carried
snowmobiles and PWs. The selling price would average $3,500 per unit. The cost
of goods sold was expected to be $3,000 per unit. Non-traceable factory costs
were expected to be $650,000 per year, and an additional $175,000 in annual
administration costs related to the new plant would be incurred at head office. No
new sales staff would be required, but sales people would receive a commission
equal to one per cent of the gross profit on each unit. It was expected that prices
and costs would increase by the inflation rate over the life of this project.
To remain up to date with technology, a major overhaul of the product would be
required at the end of the 10th year. Research and development (R&D) costs of
approximately $100,000 each year would be incurred prior to the introduction of
the new model, and a $1 million overhaul of the production process would be
undertaken near the end of Year 10. This overhaul could be completed on
weekends, and would not interfere with factory production. The new equipment
would be in the same CCA class as the other production equipment, and the R&D
costs would qualify for a 20 per cent investment tax credit each year.
COST OF FINANCING
In the past, PC had used the treasury spread approach to estimate the cost of its
debt and then applied a historical average risk premium to determine the cost of
equity (common shares) financing. As the company had become more financially
sophisticated, it decided to use the capital asset pricing model (CAPM) for
calculating the cost of equity and to determine the cost of debt using the implied
rate for bonds or recently negotiated rates for bank loans. When these rates were
not available, bonds rates of companies with similar bond rating were used.
PC calculated its Beta using monthly return data over a five-year estimating
period. Exhibit 1 shows the most recent data used. The six per cent return on the
10-year treasury bond was used as a proxy for the risk-free rate. The market risk
premium was calculated using return data for the national stock index and the 10-
year treasury bond for 1973-2000. Exhibit 2 shows the current data.
Recently, PC did a private placement of a 10-year bond issue with a major life
insurance company. The bond had a coupon rate of eight per cent and sold at a
premium of $105.
PC realized that diversifying into front-end loaders represented a move into a
riskier industry. Construction was more cyclical than recreational vehicles and
was thus subject to intense foreign competition particularly from many emerging
low-wage economies, such as China. Obviously, using the companys current cost
of capital would be a mistake.
PC was able to identify five companies that produced a similar product. Their
debt/equity ratios varied considerably, and two (Henderson and Cramer) were
multi-divisional companies that manufactured different products or delivered
services in more than one industry (see Exhibit 3). The corporate tax rate was 35
per cent.
CAPITAL BUDGET
PC had adopted a debt ratio of 30 per cent as its target capital structure, based on a
worst-case scenario analysis done by A&G Consulting. PC planned on
maintaining this ratio in the future as it attempted to grow its business through
these and other expansion projects.
Company policy was to fund all growth with retained earnings and debt. The
rationale for this policy was that retained earnings were cheaper than issuing new
equity, and the founding family of PC (the Waltersons) desired to maintain control
over the business their ownership stake was currently 55 per cent. The
company had not issued new equity in more than 20 years, although in some years,
it had to delay positive net present value (NPV) projects due to a lack of internally
generated equity.
Of the current years capital budget, $5 million was earmarked for mandatory
renovations on existing buildings and equipment to comply with health and safety
regulations. Pleasure Craft expected to generate approximately $20 million in new
equity in the current year.
The cost of issuing new equity had been estimated at eight per cent of the funds
raised, while the cost of debt was only three per cent. Company policy was to
include all issuance costs in the cost of capital.
DECISION PROBLEMS
Cummins, Team Badger leader, had been asked by Jane Meadows, vice-president
of operations, to supply an estimate of the costs of capital that were suitable for
analysing these two expansion projects. Meadows requested a detailed analysis of
how these figures were calculated and their limitations.
Meadows also asked that Team Badger complete a detailed evaluation of the two
expansion options, calculating cash flows on a quarterly basis. Team Badger was
also asked to make a recommendation on which project(s) to select and provide
quantitative and non-quantitative rationale for their decision. The NPV approach
should be the primary method used, as per company policy, but the internal rate of
revenue (IRR) should also be calculated for each project.
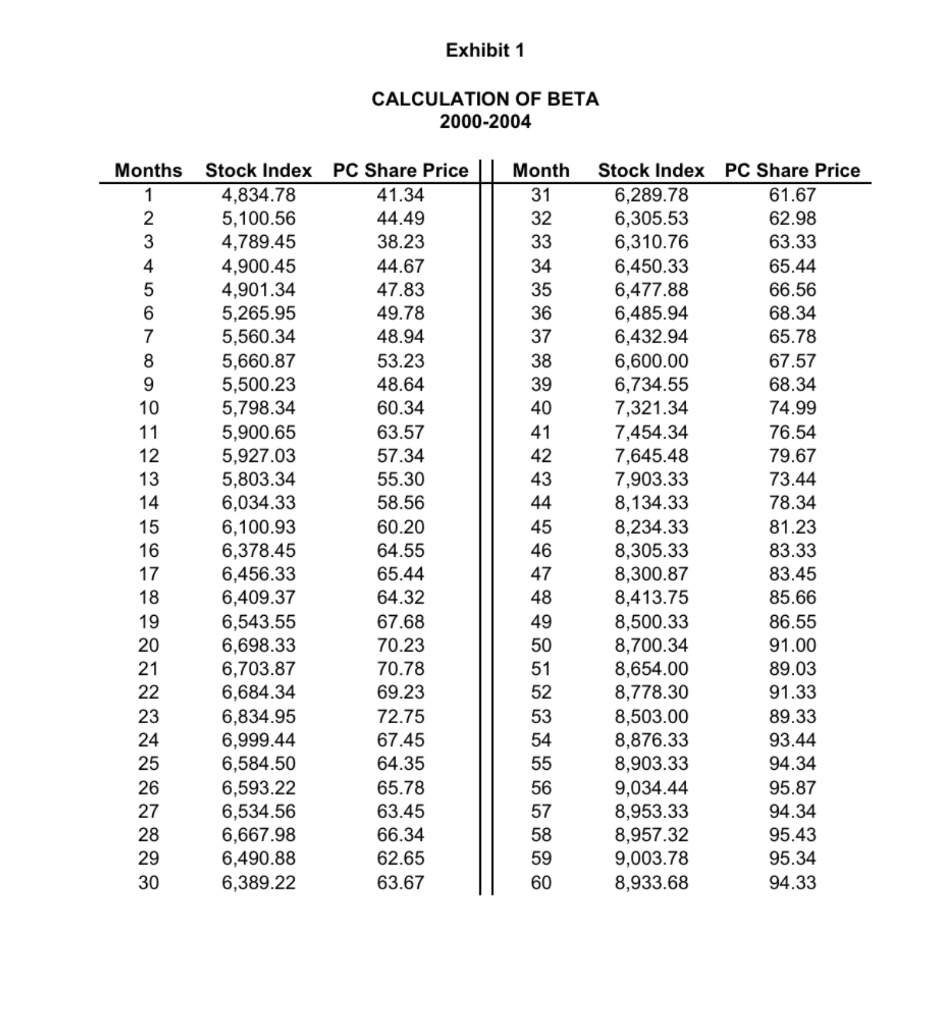
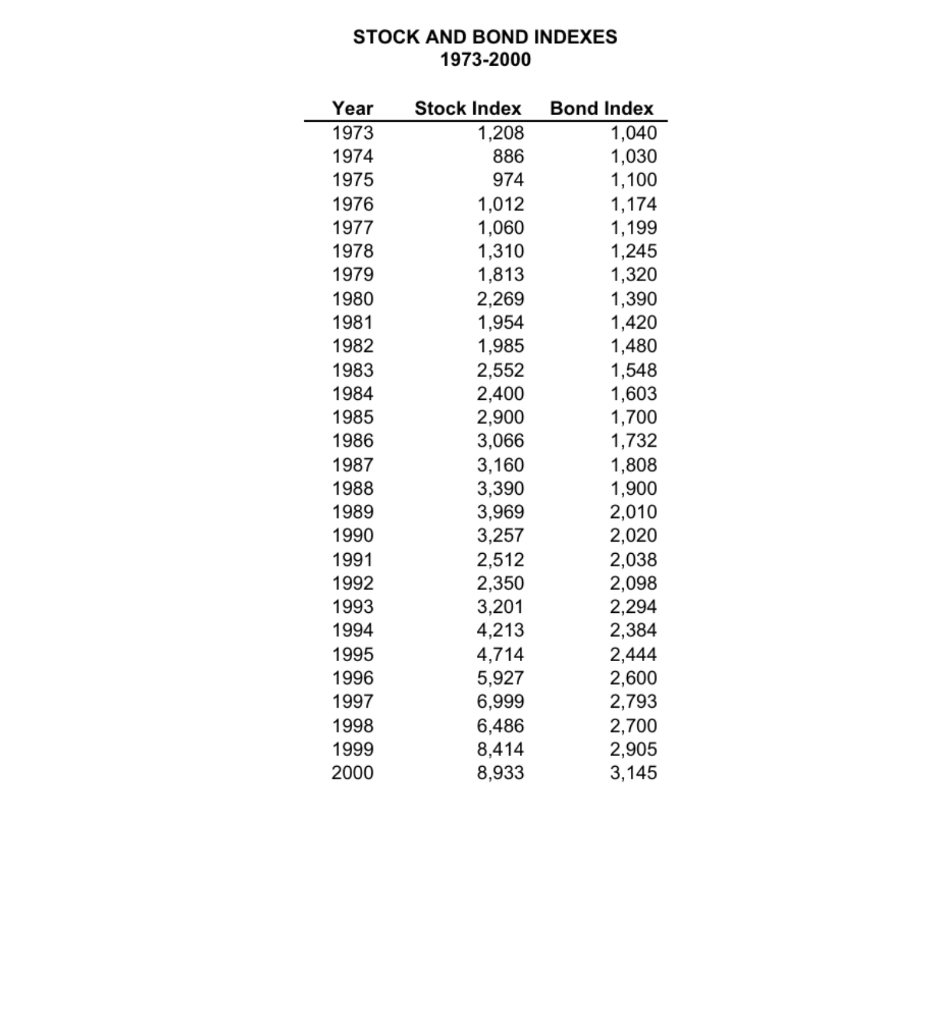
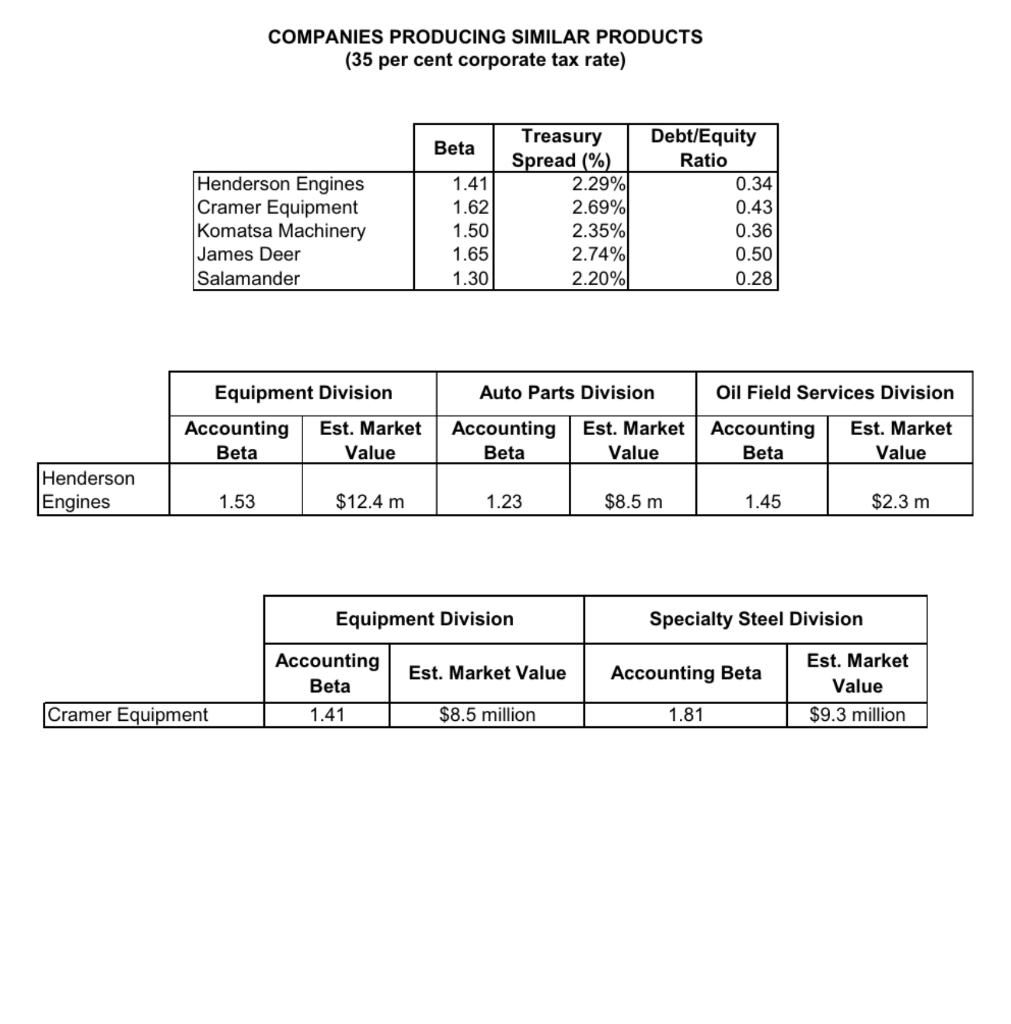
Exhibit 1 CALCULATION OF BETA 2000-2004 Months 1 2 3 4 5 6 7 8 9 10 11 12 13 14 15 16 17 18 19 20 21 22 23 24 25 26 27 28 29 30 Stock Index PC Share Price 4,834.78 41.34 5,100.56 44.49 4,789.45 38.23 4,900.45 44.67 4,901.34 47.83 5,265.95 49.78 5,560.34 48.94 5,660.87 53.23 5,500.23 48.64 5,798.34 60.34 5,900.65 63.57 5,927.03 57.34 5,803.34 55.30 6,034.33 58.56 6,100.93 60.20 6,378.45 64.55 6,456.33 65.44 6,409.37 64.32 6,543.55 67.68 6,698.33 70.23 6,703.87 70.78 6,684.34 69.23 6,834.95 72.75 6,999.44 67.45 6,584.50 64.35 6,593.22 65.78 6,534.56 63.45 6,667.98 66.34 6,490.88 62.65 6,389.22 63.67 Month 31 32 33 34 35 36 37 38 39 40 41 42 43 44 45 46 47 48 49 50 51 52 53 54 55 56 57 58 59 60 Stock Index PC Share Price 6,289.78 61.67 6,305.53 62.98 6,310.76 63.33 6,450.33 65.44 6,477.88 66.56 6,485.94 68.34 6,432.94 65.78 6,600.00 67.57 6,734.55 68.34 7,321.34 74.99 7,454.34 76.54 7,645.48 79.67 7,903.33 73.44 8,134.33 78.34 8,234.33 81.23 8,305.33 83.33 8,300.87 83.45 8,413.75 85.66 8,500.33 86.55 8,700.34 91.00 8,654.00 89.03 8,778.30 91.33 8,503.00 89.33 8,876.33 93.44 8,903.33 94.34 9,034.44 95.87 8,953.33 94.34 8,957.32 95.43 9,003.78 95.34 8,933.68 94.33 STOCK AND BOND INDEXES 1973-2000 Year 1973 1974 1975 1976 1977 1978 1979 1980 1981 1982 1983 1984 1985 1986 1987 1988 1989 1990 1991 1992 1993 1994 1995 1996 1997 1998 1999 2000 Stock Index 1,208 886 974 1,012 1,060 1,310 1,813 2,269 1,954 1,985 2,552 2,400 2,900 3,066 3,160 3,390 3,969 3,257 2,512 2,350 3,201 4,213 4,714 5,927 6.999 6,486 8,414 8,933 Bond Index 1,040 1,030 1,100 1,174 1,199 1,245 1,320 1,390 1,420 1,480 1,548 1,603 1,700 1,732 1,808 1,900 2,010 2,020 2,038 2,098 2,294 2,384 2,444 2,600 2,793 2,700 2,905 3,145 COMPANIES PRODUCING SIMILAR PRODUCTS (35 per cent corporate tax rate) Beta Henderson Engines Cramer Equipment Komatsa Machinery James Deer Salamander 1.41 1.62 1.50 1.65 1.30 Treasury Spread (%) 2.29% 2.69% 2.35% 2.74% 2.20% Debt/Equity Ratio 0.34 0.43 0.36 0.50 0.28 Auto Parts Division Oil Field Services Division Equipment Division Accounting Est. Market Beta Value Accounting Beta Est. Market Value Accounting Beta Est. Market Value Henderson Engines 1.53 $12.4 m 1.23 $8.5 m 1.45 $2.3 m Equipment Division Specialty Steel Division Accounting Beta Est. Market Value Accounting Beta Est. Market Value $9.3 million Cramer Equipment 1.41 $8.5 million 1.81 Exhibit 1 CALCULATION OF BETA 2000-2004 Months 1 2 3 4 5 6 7 8 9 10 11 12 13 14 15 16 17 18 19 20 21 22 23 24 25 26 27 28 29 30 Stock Index PC Share Price 4,834.78 41.34 5,100.56 44.49 4,789.45 38.23 4,900.45 44.67 4,901.34 47.83 5,265.95 49.78 5,560.34 48.94 5,660.87 53.23 5,500.23 48.64 5,798.34 60.34 5,900.65 63.57 5,927.03 57.34 5,803.34 55.30 6,034.33 58.56 6,100.93 60.20 6,378.45 64.55 6,456.33 65.44 6,409.37 64.32 6,543.55 67.68 6,698.33 70.23 6,703.87 70.78 6,684.34 69.23 6,834.95 72.75 6,999.44 67.45 6,584.50 64.35 6,593.22 65.78 6,534.56 63.45 6,667.98 66.34 6,490.88 62.65 6,389.22 63.67 Month 31 32 33 34 35 36 37 38 39 40 41 42 43 44 45 46 47 48 49 50 51 52 53 54 55 56 57 58 59 60 Stock Index PC Share Price 6,289.78 61.67 6,305.53 62.98 6,310.76 63.33 6,450.33 65.44 6,477.88 66.56 6,485.94 68.34 6,432.94 65.78 6,600.00 67.57 6,734.55 68.34 7,321.34 74.99 7,454.34 76.54 7,645.48 79.67 7,903.33 73.44 8,134.33 78.34 8,234.33 81.23 8,305.33 83.33 8,300.87 83.45 8,413.75 85.66 8,500.33 86.55 8,700.34 91.00 8,654.00 89.03 8,778.30 91.33 8,503.00 89.33 8,876.33 93.44 8,903.33 94.34 9,034.44 95.87 8,953.33 94.34 8,957.32 95.43 9,003.78 95.34 8,933.68 94.33 STOCK AND BOND INDEXES 1973-2000 Year 1973 1974 1975 1976 1977 1978 1979 1980 1981 1982 1983 1984 1985 1986 1987 1988 1989 1990 1991 1992 1993 1994 1995 1996 1997 1998 1999 2000 Stock Index 1,208 886 974 1,012 1,060 1,310 1,813 2,269 1,954 1,985 2,552 2,400 2,900 3,066 3,160 3,390 3,969 3,257 2,512 2,350 3,201 4,213 4,714 5,927 6.999 6,486 8,414 8,933 Bond Index 1,040 1,030 1,100 1,174 1,199 1,245 1,320 1,390 1,420 1,480 1,548 1,603 1,700 1,732 1,808 1,900 2,010 2,020 2,038 2,098 2,294 2,384 2,444 2,600 2,793 2,700 2,905 3,145 COMPANIES PRODUCING SIMILAR PRODUCTS (35 per cent corporate tax rate) Beta Henderson Engines Cramer Equipment Komatsa Machinery James Deer Salamander 1.41 1.62 1.50 1.65 1.30 Treasury Spread (%) 2.29% 2.69% 2.35% 2.74% 2.20% Debt/Equity Ratio 0.34 0.43 0.36 0.50 0.28 Auto Parts Division Oil Field Services Division Equipment Division Accounting Est. Market Beta Value Accounting Beta Est. Market Value Accounting Beta Est. Market Value Henderson Engines 1.53 $12.4 m 1.23 $8.5 m 1.45 $2.3 m Equipment Division Specialty Steel Division Accounting Beta Est. Market Value Accounting Beta Est. Market Value $9.3 million Cramer Equipment 1.41 $8.5 million 1.81
Step by Step Solution
There are 3 Steps involved in it

Get step-by-step solutions from verified subject matter experts