

Question: please show step bt step process and replication no. goes to 500 Order quantity Reconsider the high-end skiwear producer of the MT. The spreadsheet model
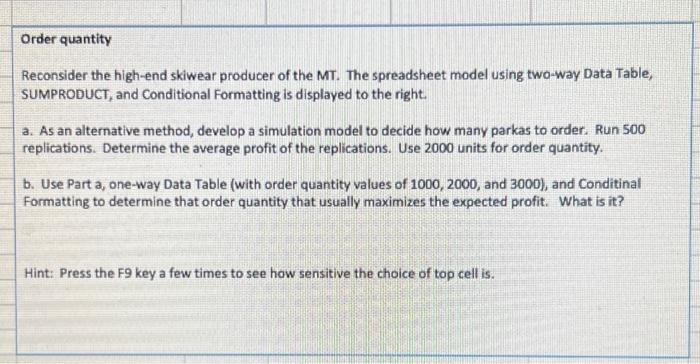
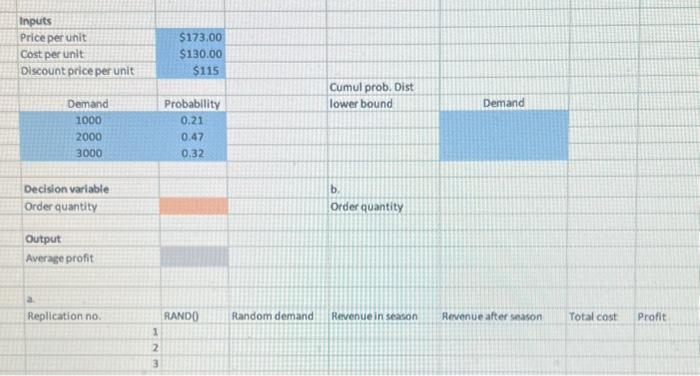
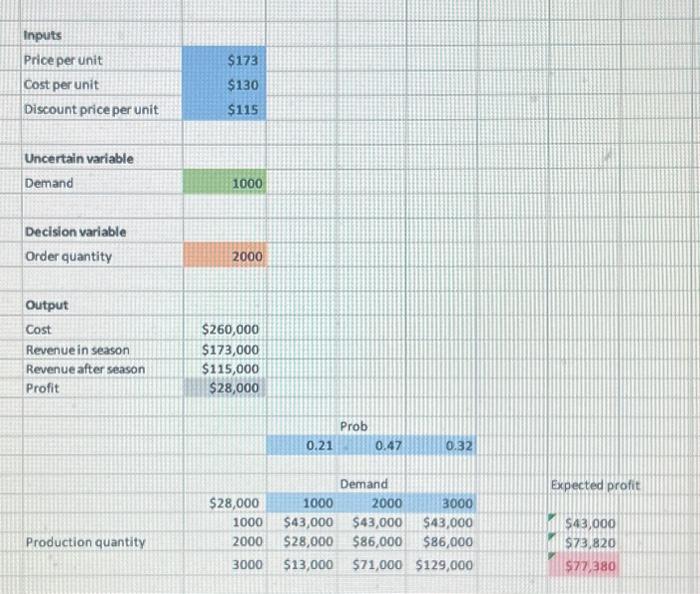
Order quantity Reconsider the high-end skiwear producer of the MT. The spreadsheet model using two-way Data Table, SUMPRODUCT, and Conditional Formatting is displayed to the right. a. As an alternative method, develop a simulation model to decide how many parkas to order. Run 500 replications. Determine the average profit of the replications. Use 2000 units for order quantity. b. Use Part a, one-way Data Table (with order quantity values of 1000,2000 , and 3000 ), and Conditinal Formatting to determine that order quantity that usually maximizes the expected profit. What is it? Hint: Press the F9 key a few times to see how sensitive the choice of top cell is. \begin{tabular}{|c|c|c|c|c|c|c|} \hline \multicolumn{7}{|l|}{ Inputs } \\ \hline Price per unit & $173,00 & & & & & \\ \hline Cost per unit & $130.00 & & & & & \\ \hline \multirow[t]{2}{*}{ Discount price per unit } & $115 & & & & & \\ \hline & & & Cumul prob. Dist & & & \\ \hline Demand & Probability & & lower bound & Demand & & \\ \hline 1000 & 0.21 & & & & & \\ \hline 2000 & 0.47 & & & & & \\ \hline 3000 & 0.32 & & & & & \\ \hline & & & & & & \\ \hline Decision variable & & & b. & & & \\ \hline Order quantity & & & Order quantity & & & \\ \hline \multicolumn{7}{|l|}{ Output } \\ \hline \multicolumn{7}{|l|}{ Average profit } \\ \hline \multicolumn{7}{|l|}{ a. =} \\ \hline Replication no. & RAND0 & Random demand & Revenue in seacon & Revenue after season & Total cost & Profit \\ \hline & & & & & & \\ \hline & & & & & & \\ \hline & & & & & & \\ \hline \end{tabular}
Step by Step Solution
There are 3 Steps involved in it

Get step-by-step solutions from verified subject matter experts