

Question: Please show step by step We have rounded : Data Point Date Weeks t # of new Data Point passed Confirmed total as an since
Please show step by step
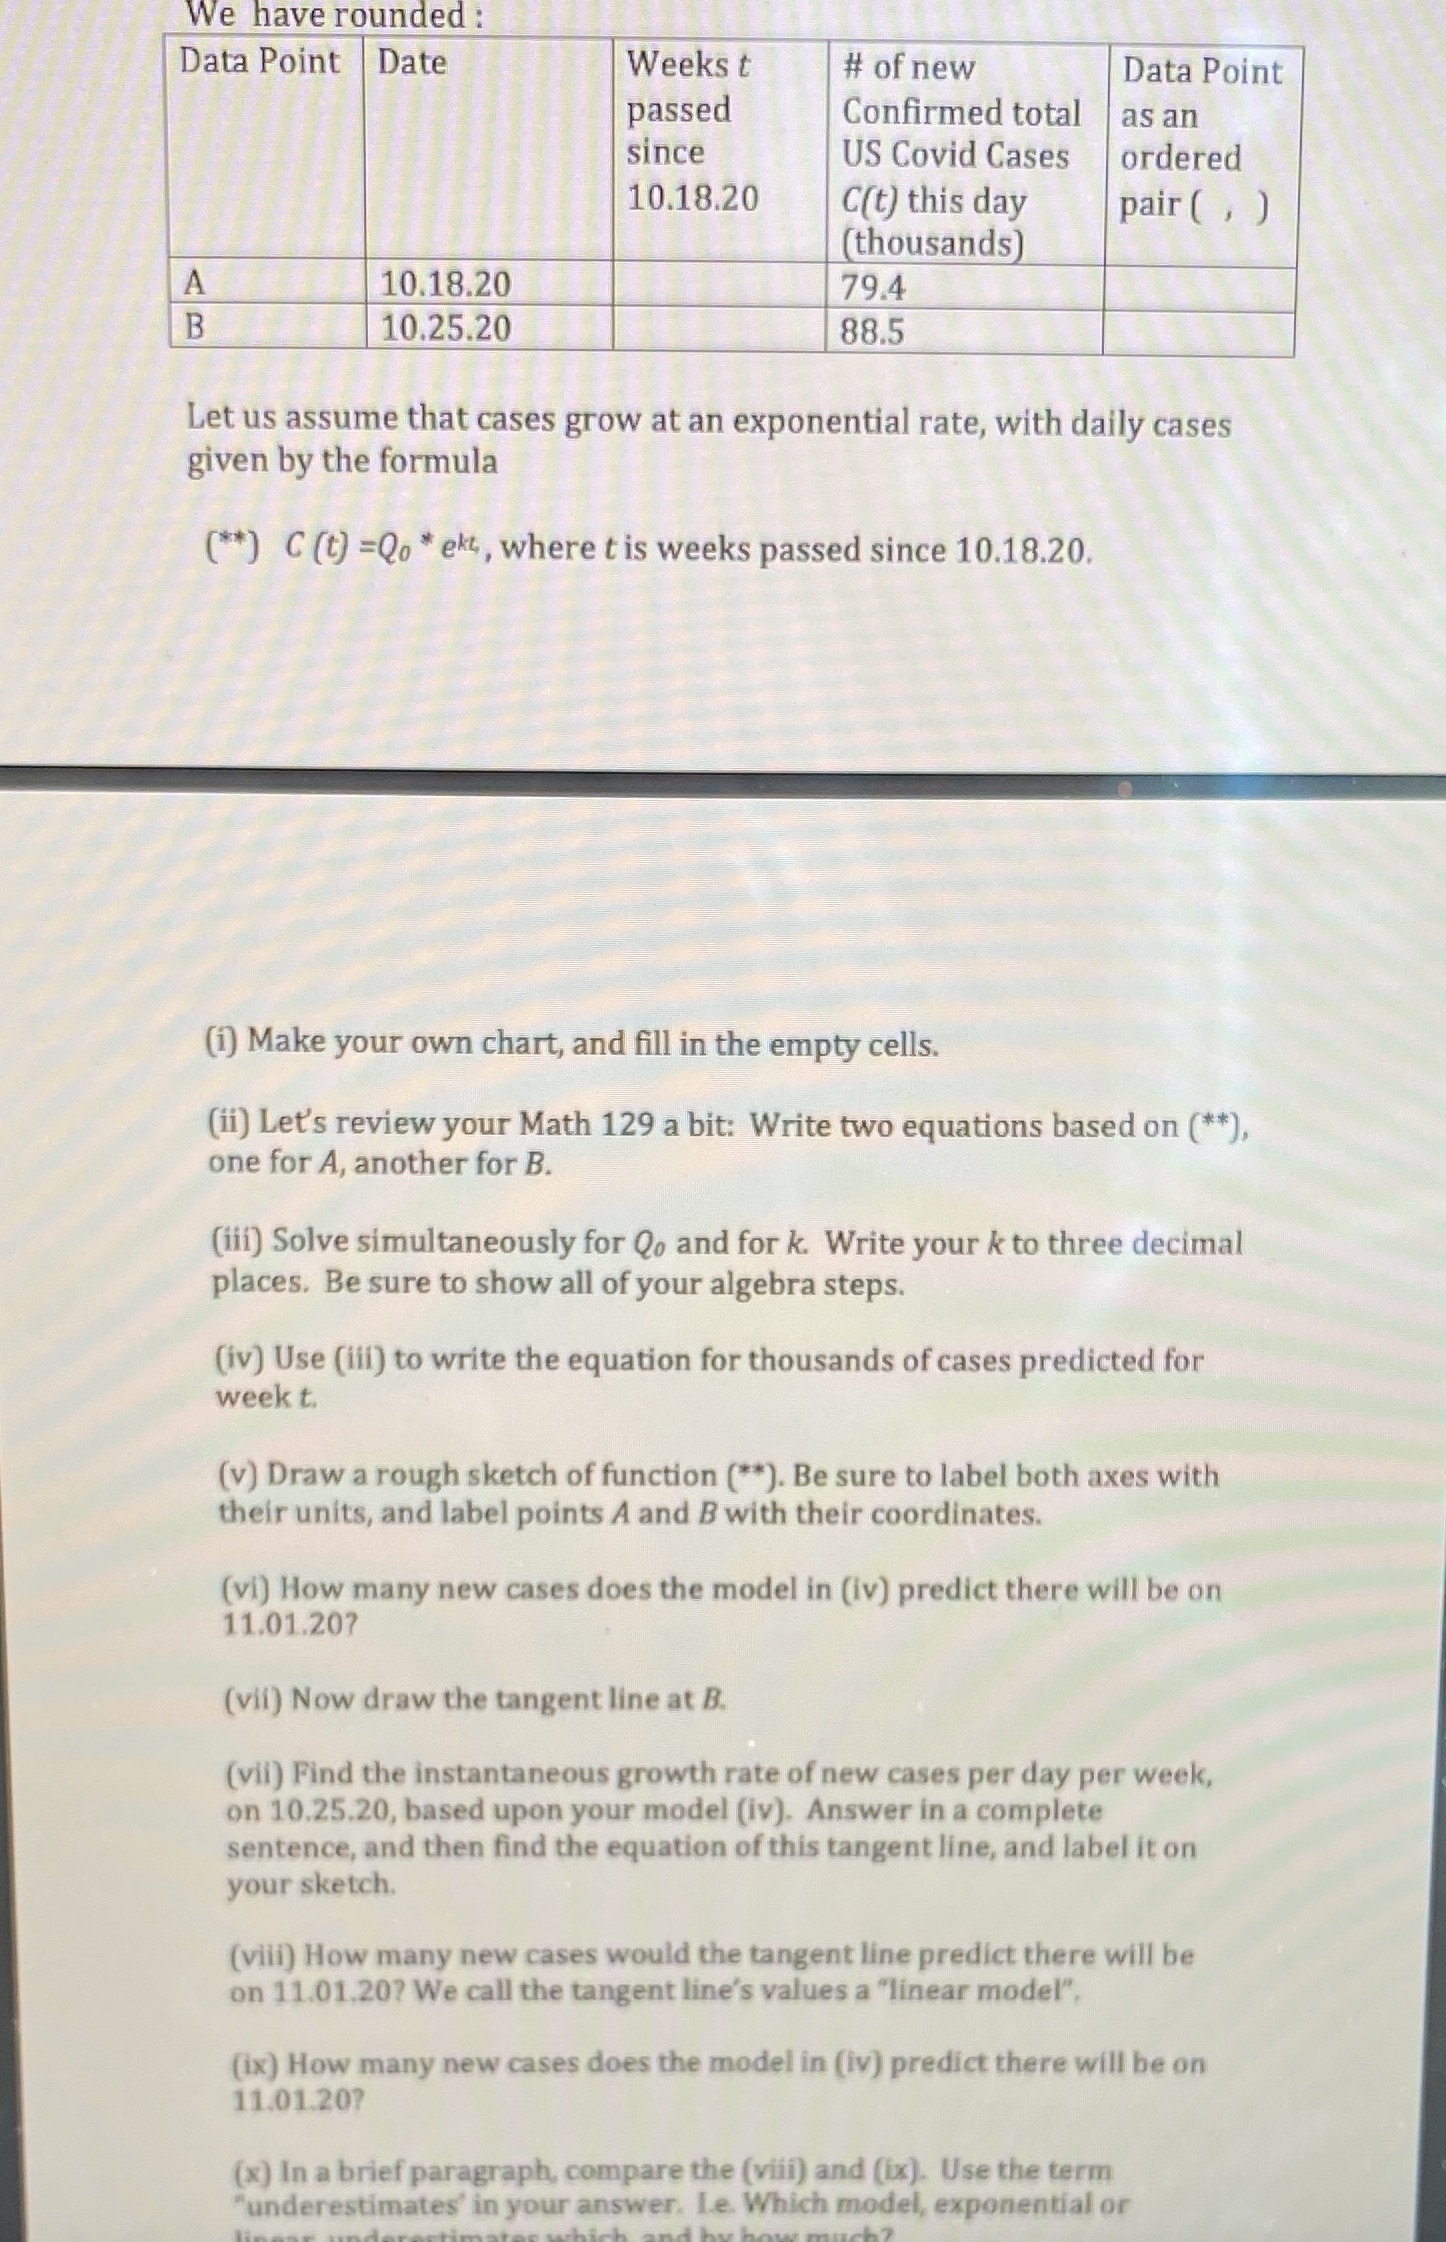
We have rounded : Data Point Date Weeks t # of new Data Point passed Confirmed total as an since US Covid Cases ordered 10.18.20 C(t) this day pair ( , ) (thousands) A 10.18.20 79.4 B 10.25.20 88.5 Let us assume that cases grow at an exponential rate, with daily cases given by the formula (**) C (t) =Qo * ekt , where t is weeks passed since 10.18.20. (i) Make your own chart, and fill in the empty cells. (ii) Let's review your Math 129 a bit: Write two equations based on (**), one for A, another for B. (iii) Solve simultaneously for Qo and for k. Write your k to three decimal places. Be sure to show all of your algebra steps. (iv) Use (iii) to write the equation for thousands of cases predicted for week t. (v) Draw a rough sketch of function (**). Be sure to label both axes with their units, and label points A and B with their coordinates. (vi) How many new cases does the model in (iv) predict there will be on 11.01.20? (vil) Now draw the tangent line at B. (vil) Find the instantaneous growth rate of new cases per day per week, on 10.25,20, based upon your model (iv). Answer in a complete sentence, and then find the equation of this tangent line, and label it on your sketch. (viii) How many new cases would the tangent line predict there will be on 11.01.20? We call the tangent line's values a "linear model". (ix) How many new cases does the model in (iv) predict there will be on 11.01.20? (x) In a brief paragraph, compare the (viii) and (ixx). Use the term "underestimates' in your answer. Le. Which model, exponential or
Step by Step Solution
There are 3 Steps involved in it

Get step-by-step solutions from verified subject matter experts