

Question: Please show the code to plot x(t), g1(t), g2(t),...g5(t) please. Thanks! TASK 3: Signal Correlation The concept of signal correlation introduced this week can be
Please show the code to plot x(t), g1(t), g2(t),...g5(t) please. Thanks! 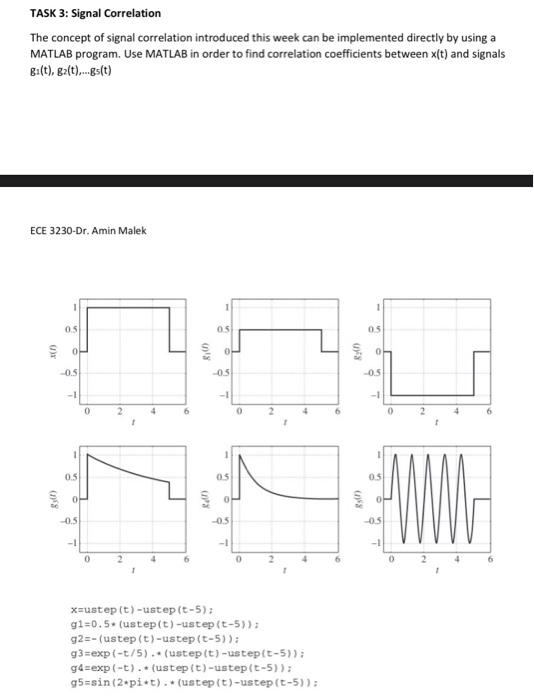
TASK 3: Signal Correlation The concept of signal correlation introduced this week can be implemented directly by using a MATLAB program. Use MATLAB in order to find correlation coefficients between x(t) and signals 8:(t), sz(t)....Bs(t) ECE 3230-Dr. Amin Malek 1 05 05 05 0 0.5 05 -0.5 0 4 6 0 0.5 05 0.5 0 OH -05 -0.5 -05 -- -1 6 0 0 2 x=ustep (t) -ustep (t-5); g1=0.5: (ustep(t)-ustep (t-5)): 92=-(ustep (t)-ustep (t-5)): g3=exp(-t/5). (ustep (t) -ustep(t-5)): gd-exp(-t). (ustep (t)-ustep(-5)); g5=sin(2-pi-t)..(ustep (t) -ustep (t-5))
Step by Step Solution
There are 3 Steps involved in it
1 Expert Approved Answer
Step: 1 Unlock

Question Has Been Solved by an Expert!
Get step-by-step solutions from verified subject matter experts
Step: 2 Unlock
Step: 3 Unlock