

Question: X1. Use the assumptions described in the table when modeling items that are not computed as totals or subtotals, or that are not computed using
X1. Use the assumptions described in the table when modeling items that are not computed as totals or subtotals, or that are not computed using information available from the model.
| Variable | Modeling assumptions |
| Revenue | Annual revenue growth in each forecast year equals the weighted average of growth rates from the historical period, where the last year of the historical period is weighted at 55 percent, the year before that is weighted at 15 percent, and the year before that is weighted at 30 percent. |
| Cost of sales | Cost of sales to revenue in forecast year is the average from the last 3 historical years |
| SG&A and other indirect expenses | SG&A and other indirect expenses to revenue in forecast year is 1.08 percentage points better than the ratio from the previous year |
| Accounts receivable | Accounts receivable days in forecast year is 2.34 days greater than the average annual receivable days from the historical period |
| Inventory | Inventory days in forecast year equals the average annual inventory days from the last 2 years of the historical period |
| Accounts payable | Accounts payable days in forecast year is 1.62 days less than the accounts payable days from the last year of the historical period |
Please show us the formula and the work on excel, please help me!
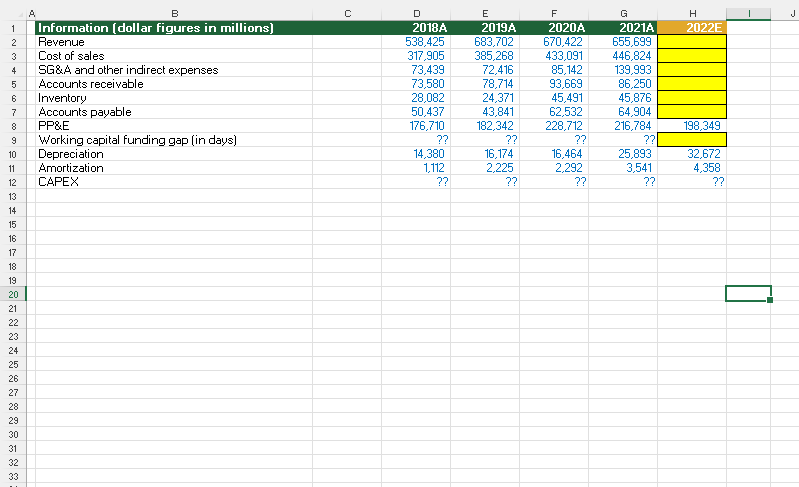
A B c 1 J H 2022E Information (dollar figures in millions) Revenue Cost of sales SG&A and other indirect expenses Accounts receivable Inventory Accounts payable PP&E Working capital funding gap (in days) Depreciation Amortization CAPEX D 2018A 538,425 317,905 73,439 73,580 28,082 50,437 176,710 ?? 14,380 1.112 ?? E 2019A 683,702 385,268 72,416 78,714 24,371 43,841 182.342 ?? 16,174 2,225 ?? F 2020A 670,422 433,091 85,142 93,669 45,491 62,532 228.712 ?? 16,464 2,292 ?? G 2021A 655,699 446,824 139,993 86,250 45,876 64,904 216,784 ?? 25,893 3,541 ?? 198,349 32,672 4,358 ?? 1 2 3 4 5 6 7 8 9 10 11 12 13 14 15 16 17 18 19 20 21 22 23 24 25 26 27 28 29 30 31 32 33 A B c 1 J H 2022E Information (dollar figures in millions) Revenue Cost of sales SG&A and other indirect expenses Accounts receivable Inventory Accounts payable PP&E Working capital funding gap (in days) Depreciation Amortization CAPEX D 2018A 538,425 317,905 73,439 73,580 28,082 50,437 176,710 ?? 14,380 1.112 ?? E 2019A 683,702 385,268 72,416 78,714 24,371 43,841 182.342 ?? 16,174 2,225 ?? F 2020A 670,422 433,091 85,142 93,669 45,491 62,532 228.712 ?? 16,464 2,292 ?? G 2021A 655,699 446,824 139,993 86,250 45,876 64,904 216,784 ?? 25,893 3,541 ?? 198,349 32,672 4,358 ?? 1 2 3 4 5 6 7 8 9 10 11 12 13 14 15 16 17 18 19 20 21 22 23 24 25 26 27 28 29 30 31 32 33
Step by Step Solution
There are 3 Steps involved in it

Get step-by-step solutions from verified subject matter experts