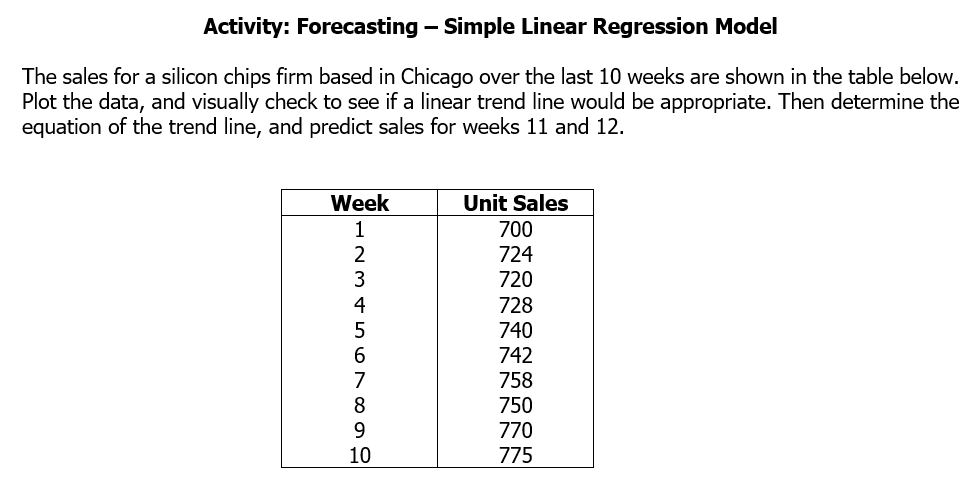
Question: Please show the solution. Thank you! :) Activity: Forecasting - Simple Linear Regression Model The sales for a silicon chips firm based in Chicago over

Please show the solution. Thank you! :)

Please show the solution. Thank you! :) Activity:

Please show the solution. Thank you! :) Activity:

Activity: Forecasting - Simple Linear Regression Model The sales for a silicon chips firm based in Chicago over the last 10 weeks are shown in the table below. Plot the data, and visually check to see if a linear trend line would be appropriate. Then determine the equation of the trend line, and predict sales for weeks 11 and 12. Week 1 2 3 4 5 Unit Sales 700 724 720 728 7 8 9 10 740 742 758 750 770 775 Solution: X-week x? y-unit sales xy Sum= Average= Sum= Average= 11 12 b= a= Regression Model

Step by Step Solution

There are 3 Steps involved in it

1 Expert Approved Answer
Step: 1 Unlock blur-text-image
Question Has Been Solved by an Expert!

Get step-by-step solutions from verified subject matter experts

Step: 2 Unlock
Step: 3 Unlock

Students Have Also Explored These Related General Management Questions!