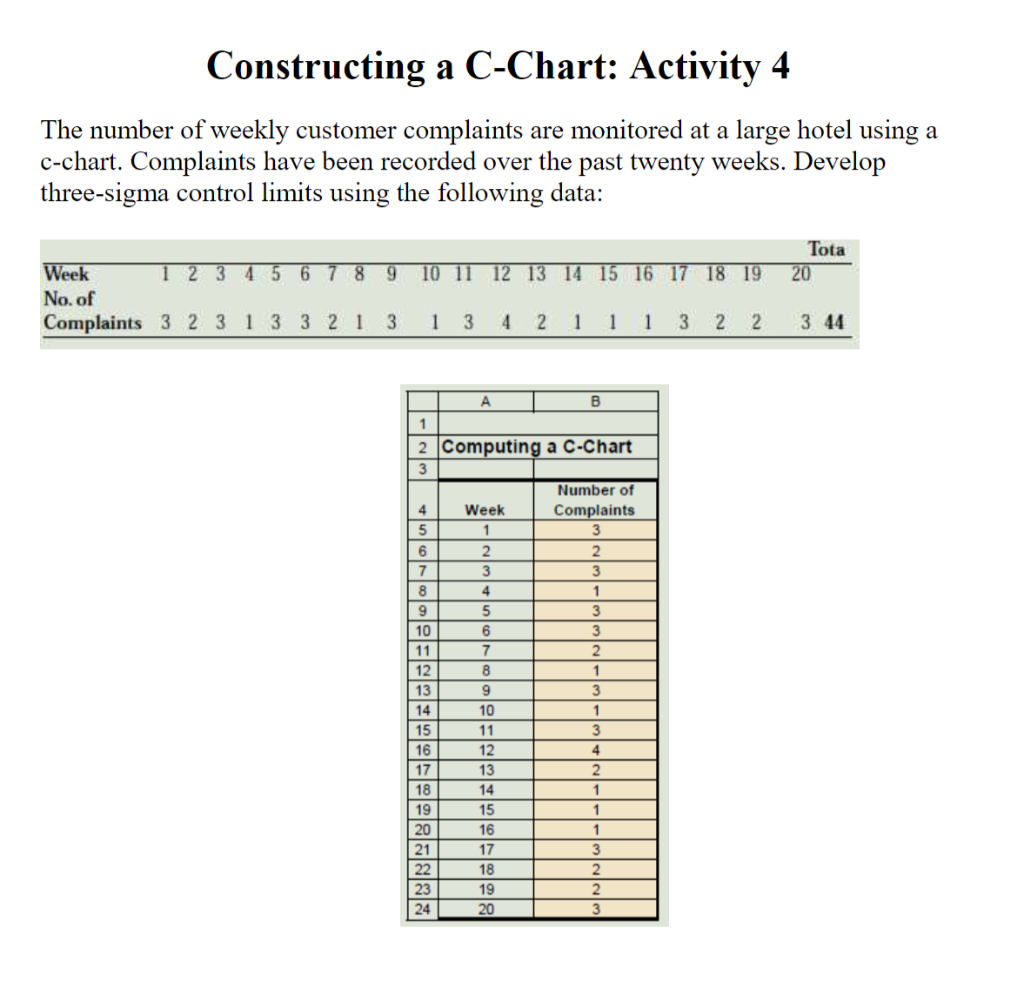
Question: Please show work, and how to get Z-Value for control charts Constructing a C-Chart: Activity 4 The number of weekly customer complaints are monitored at

Please show work, and how to get Z-Value for control charts

Please show work, and how to get Z-Value for

Constructing a C-Chart: Activity 4 The number of weekly customer complaints are monitored at a large hotel using a c-chart. Complaints have been recorded over the past twenty weeks. Develop three-sigma control limits using the following data: Tota 20 10 11 12 13 14 15 16 17 18 19 Week 1 2 3 4 5 6 7 8 9 No. of Complaints 3 2 3 1 3 3 2 1 3 1 3 4 2 1 1 1 3 2 2 3 44 A B 1 2 Computing a C-Chart 3 4 5 6 7 8 9 10 11 12 13 14 15 16 17 18 19 20 21 22 23 24 Week 1 2 3 4 5 6 7 8 9 10 11 12 13 14 15 16 17 18 19 20 Number of Complaints 3 2 3 1 3 3 2. 1 3 1 3 4 2 1 1 1 3 2 2 3

Step by Step Solution

There are 3 Steps involved in it

1 Expert Approved Answer
Step: 1 Unlock blur-text-image
Question Has Been Solved by an Expert!

Get step-by-step solutions from verified subject matter experts

Step: 2 Unlock
Step: 3 Unlock

Students Have Also Explored These Related General Management Questions!