

Question: Please show work and steps using Excel The following table summarizes the return and risk of an actively managed portfolio P and the market portfolio
Please show work and steps using Excel
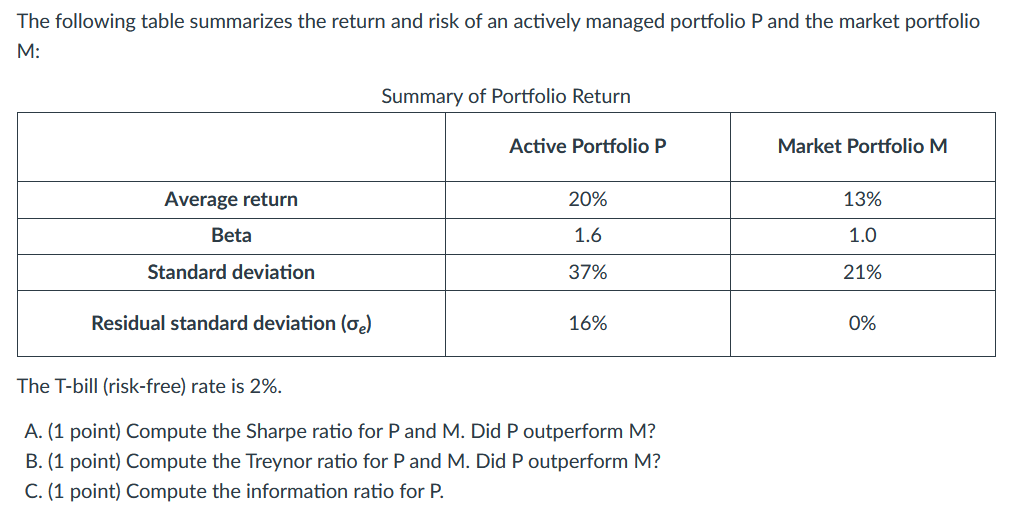
The following table summarizes the return and risk of an actively managed portfolio P and the market portfolio M: Summary of Portfolio Return Active Portfolio P Market Portfolio M Average return 20% 13% Beta 1.6 1.0 Standard deviation 37% 21% Residual standard deviation (oe) 16% 0% The T-bill (risk-free) rate is 2%. A. (1 point) Compute the Sharpe ratio for P and M. Did P outperform M? B. (1 point) Compute the Treynor ratio for P and M. Did P tperform M? C. (1 point) Compute the information ratio for P
Step by Step Solution
There are 3 Steps involved in it
1 Expert Approved Answer
Step: 1 Unlock

Question Has Been Solved by an Expert!
Get step-by-step solutions from verified subject matter experts
Step: 2 Unlock
Step: 3 Unlock