

Question: Use the attached G20 macro data on Oct 25, 2021 from the Economist to answer the following questions Current spot rates . What are the
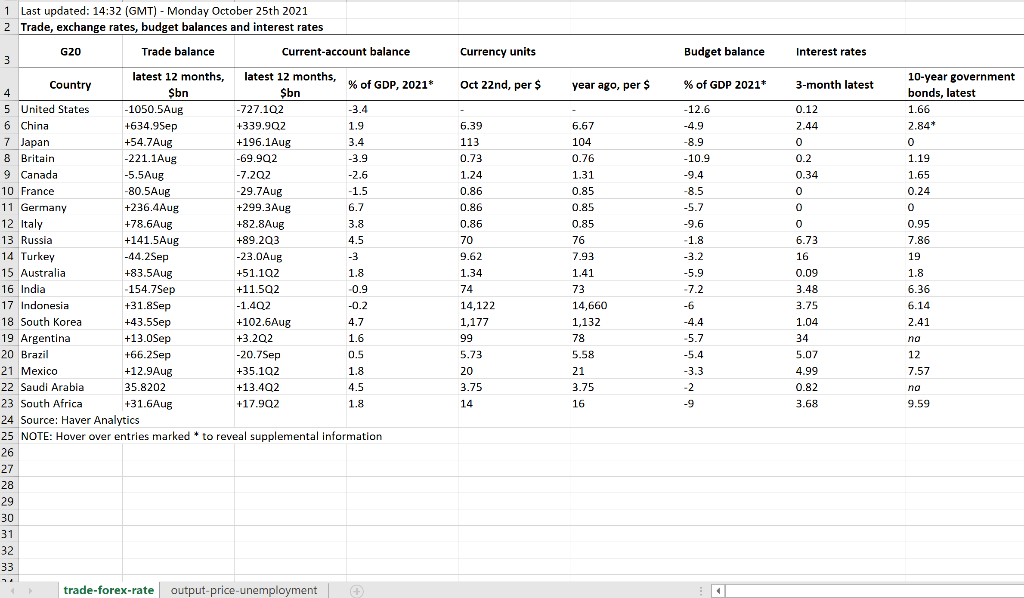
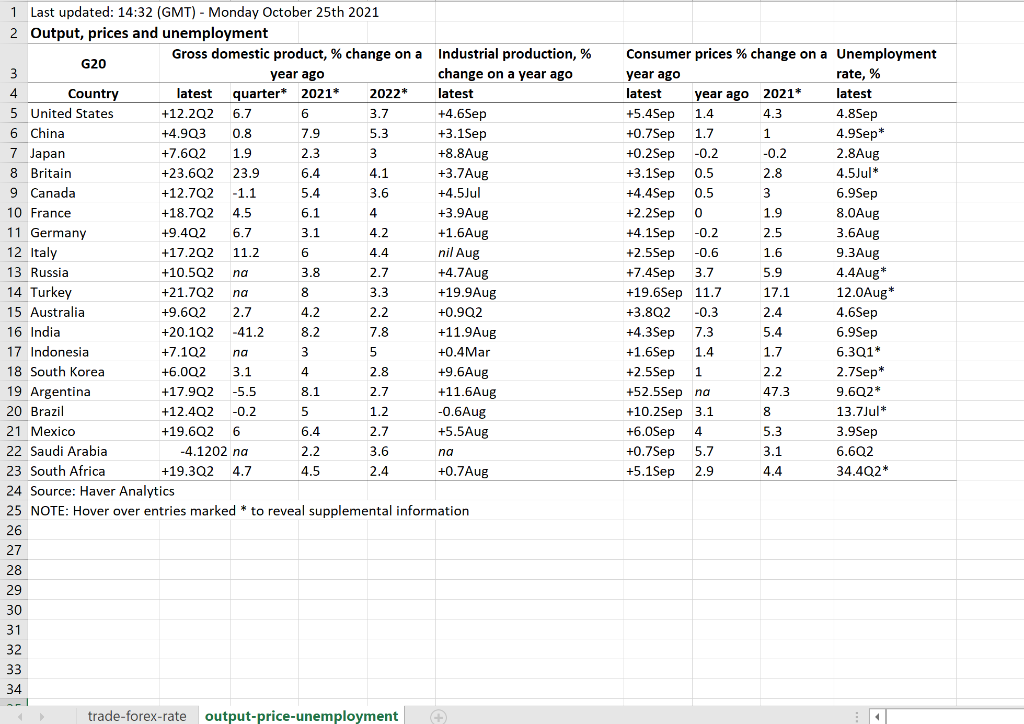
Use the attached G20 macro data on Oct 25, 2021 from the Economist to answer the following questions
- Current spot rates. What are the current spot rate exchange rate for the following cross-rates:
- Brazil real/US dollar.
- South African rand/US dollar
- South African rand/Brazil real
 And please show work
- Currency units Budget balance Interest rates Oct 22nd, per $ , year ago, per $ % of GDP 2021* 3-month latest - 0.12 2.44 0 0.2 -80.5Aug 1 Last updated: 14:32 (GMT) - Monday October 25th 2021 2 Trade, exchange rates, budget balances and interest rates G20 Trade balance Current-account balance 3 3 latest 12 months, latest 12 months, Country % of GDP, 2021* 4 $bn $bn 5 United States -1050.5Aug -727.102 -3.4 6 China +634.95ep +339.902 1.9 7 Japan +54.7Aug +196.1 Aug 3.4 8 Britain -221.1 Aug -69.902 -3.9 9 Canada -5.5Aug -7.202 -2.6 7.2 29 10 France -29.7Aug -1.5 France 2 +236.4Aug +299.3Aug 6.7 12 Italy +78.6Aug +82.8Aug 3.8 wiu 13 Russia +141.5 Aug +89.203 4.5 14 Turkey -44.2Sep -23.0Aug 2 -3 15 Australia 1935Aug +83.5Aug +51.102 1.8 154.7Sep 11.592 -0.9 17 Indonesia 12 102 -1.402 +31.8Sep -0.2 18 South ws 18 South Korea +43.55ep +102.6 Aug 4.7 10 112 con +2200 19 Argentina +13.0Sep +3.202 1.6 20. 20 Brazil +66.2Sep -20.7Sep 0.5 mu 21 Mexico +12.9Aug +35.192 1.8 22 Saudi Arabia 35.8202 +13.402 4.5 23 South Africa +31.6Aug +17.902 1.8 24 Source: Haver Analytics 25 NOTE: Hover over entries marked * to reveal supplemental information 26 27. 28 29 30 31 32 33 11 Germany 6.39 113 0.73 1.24 0.86 0.86 0.86 0.86 70 no 9.62 9.62 1.34 74 74 14.122 177 po 99 5.73 20 3.75 6.67 104 0.76 1.31 1:31 0.85 0.03 0.85 0.85 0.85 V.03 76 70 7.93 1.41 73 14.660 1132 78 70 5.58 21 3.75 -12.6 -4.9 -8.9 -10.9 -9.4 -8.5 -5.7 -9.6 9.0 -1.8 -3.2 -5.9 -7.2 -6 A -4.4 -5.7 -5.4 10-year government bonds, latest 1.66 2.84* 0 1.19 1.65 0.24 0 0.95 7.86 19 13 18 1.8 6.36 6.14 2.41 0.34 Vie 0 0 0 6.73 16 16 0.09 3.48 3.75 100 1.04 16 India 34 no -3.3 -2 -9 5.07 4.99 0.82 3.68 12 7.57 no 9.59 14 16 14 trade-forex-rate output-price-unemployment - G+ 12 Italy 1 Last updated: 14:32 (GMT) - Monday October 25th 2021 2 Output, prices and unemployment Gross domestic product, % change on a Industrial production, % G20 3 year ago change on a year ago 4 Country latest quarter* 2021* 2022* latest 5 United States +12.202 6.7 6 3.7 +4.6Sep 6 China +4.903 0.8 7.9 5.3 +3.1 Sep 7 Japan +7.602 1.9 2.3 3 3 +8.8Aug 8 Britain +23.6Q2 23.9 6.4 4.1 +3.7Aug 9 Canada +12.702 -1.1 5.4 3.6 +4.5Jul 10 France +18.702 4.5 6.1 4 +3.9Aug 11 Germany +9.402 6.7 3.1 4.2 +1.6Aug +17.202 11.2 6 4.4 nil Aug 13 Russia +10.502 na 3.8 2.7 +4.7Aug 14 Turkey +21.702 na 8 3.3 +19.9Aug 15 Australia +9.602 2.7 4.2 2.2 +0.9Q2 16 India +20.102 -41.2 8.2 7.8 +11.9Aug 17 Indonesia +7.102 na 3 5 +0.4Mar 18 South Korea +6.002 3.1 4 2.8 +9.6Aug 19 Argentina +17.902 -5.5 8.1 2.7 +11.6Aug 20 Brazil +12.402 -0.2 5 1.2 -0.6Aug 21 Mexico +19.602 6 6.4 2.7 +5.5Aug 22 Saudi Arabia -4.1202 na 2.2 3.6 na 23 South Africa +19.302 4.7 4.5 2.4 +0.7Aug 24 Source: Haver Analytics 25 NOTE: Hover over entries marked * to reveal supplemental information 26 27 28 29 30 31 32 33 34 Consumer prices % change on a Unemployment year ago rate, % latest year ago 2021* latest +5.45ep 1.4 4.3 4.8 Sep +0.7 Sep 1.7 1 4.9Sep* +0.2Sep -0.2 -0.2 2.8Aug +3.1 Sep 0.5 2.8 4.5Jul* +4.4Sep 0.5 3 6.9Sep +2.2 Sep 0 1.9 8.0Aug +4.1 Sep -0.2 2.5 3.6Aug +2.5Sep -0.6 1.6 9.3Aug +7.45ep 3.7 5.9 4.4Aug* +19.6Sep 11.7 17.1 12.0Aug* +3.802 -0.3 2.4 4.6Sep +4.3 Sep 7.3 5.4 6.9Sep +1.6 Sep 1.4 1.7 6.3015 +2.5Sep 1 2.2 2.7Sep* +52.5Sep na 47.3 9.6Q2* +10.2Sep 3.1 8 13.7Jul* +6.0Sep 4 5.3 3.9Sep +0.7Sep 5.7 3.1 6.6Q2 +5.1 Sep 2.9 4.4 34.402* trade-forex-rate output-price-unemployment - Currency units Budget balance Interest rates Oct 22nd, per $ , year ago, per $ % of GDP 2021* 3-month latest - 0.12 2.44 0 0.2 -80.5Aug 1 Last updated: 14:32 (GMT) - Monday October 25th 2021 2 Trade, exchange rates, budget balances and interest rates G20 Trade balance Current-account balance 3 3 latest 12 months, latest 12 months, Country % of GDP, 2021* 4 $bn $bn 5 United States -1050.5Aug -727.102 -3.4 6 China +634.95ep +339.902 1.9 7 Japan +54.7Aug +196.1 Aug 3.4 8 Britain -221.1 Aug -69.902 -3.9 9 Canada -5.5Aug -7.202 -2.6 7.2 29 10 France -29.7Aug -1.5 France 2 +236.4Aug +299.3Aug 6.7 12 Italy +78.6Aug +82.8Aug 3.8 wiu 13 Russia +141.5 Aug +89.203 4.5 14 Turkey -44.2Sep -23.0Aug 2 -3 15 Australia 1935Aug +83.5Aug +51.102 1.8 154.7Sep 11.592 -0.9 17 Indonesia 12 102 -1.402 +31.8Sep -0.2 18 South ws 18 South Korea +43.55ep +102.6 Aug 4.7 10 112 con +2200 19 Argentina +13.0Sep +3.202 1.6 20. 20 Brazil +66.2Sep -20.7Sep 0.5 mu 21 Mexico +12.9Aug +35.192 1.8 22 Saudi Arabia 35.8202 +13.402 4.5 23 South Africa +31.6Aug +17.902 1.8 24 Source: Haver Analytics 25 NOTE: Hover over entries marked * to reveal supplemental information 26 27. 28 29 30 31 32 33 11 Germany 6.39 113 0.73 1.24 0.86 0.86 0.86 0.86 70 no 9.62 9.62 1.34 74 74 14.122 177 po 99 5.73 20 3.75 6.67 104 0.76 1.31 1:31 0.85 0.03 0.85 0.85 0.85 V.03 76 70 7.93 1.41 73 14.660 1132 78 70 5.58 21 3.75 -12.6 -4.9 -8.9 -10.9 -9.4 -8.5 -5.7 -9.6 9.0 -1.8 -3.2 -5.9 -7.2 -6 A -4.4 -5.7 -5.4 10-year government bonds, latest 1.66 2.84* 0 1.19 1.65 0.24 0 0.95 7.86 19 13 18 1.8 6.36 6.14 2.41 0.34 Vie 0 0 0 6.73 16 16 0.09 3.48 3.75 100 1.04 16 India 34 no -3.3 -2 -9 5.07 4.99 0.82 3.68 12 7.57 no 9.59 14 16 14 trade-forex-rate output-price-unemployment - G+ 12 Italy 1 Last updated: 14:32 (GMT) - Monday October 25th 2021 2 Output, prices and unemployment Gross domestic product, % change on a Industrial production, % G20 3 year ago change on a year ago 4 Country latest quarter* 2021* 2022* latest 5 United States +12.202 6.7 6 3.7 +4.6Sep 6 China +4.903 0.8 7.9 5.3 +3.1 Sep 7 Japan +7.602 1.9 2.3 3 3 +8.8Aug 8 Britain +23.6Q2 23.9 6.4 4.1 +3.7Aug 9 Canada +12.702 -1.1 5.4 3.6 +4.5Jul 10 France +18.702 4.5 6.1 4 +3.9Aug 11 Germany +9.402 6.7 3.1 4.2 +1.6Aug +17.202 11.2 6 4.4 nil Aug 13 Russia +10.502 na 3.8 2.7 +4.7Aug 14 Turkey +21.702 na 8 3.3 +19.9Aug 15 Australia +9.602 2.7 4.2 2.2 +0.9Q2 16 India +20.102 -41.2 8.2 7.8 +11.9Aug 17 Indonesia +7.102 na 3 5 +0.4Mar 18 South Korea +6.002 3.1 4 2.8 +9.6Aug 19 Argentina +17.902 -5.5 8.1 2.7 +11.6Aug 20 Brazil +12.402 -0.2 5 1.2 -0.6Aug 21 Mexico +19.602 6 6.4 2.7 +5.5Aug 22 Saudi Arabia -4.1202 na 2.2 3.6 na 23 South Africa +19.302 4.7 4.5 2.4 +0.7Aug 24 Source: Haver Analytics 25 NOTE: Hover over entries marked * to reveal supplemental information 26 27 28 29 30 31 32 33 34 Consumer prices % change on a Unemployment year ago rate, % latest year ago 2021* latest +5.45ep 1.4 4.3 4.8 Sep +0.7 Sep 1.7 1 4.9Sep* +0.2Sep -0.2 -0.2 2.8Aug +3.1 Sep 0.5 2.8 4.5Jul* +4.4Sep 0.5 3 6.9Sep +2.2 Sep 0 1.9 8.0Aug +4.1 Sep -0.2 2.5 3.6Aug +2.5Sep -0.6 1.6 9.3Aug +7.45ep 3.7 5.9 4.4Aug* +19.6Sep 11.7 17.1 12.0Aug* +3.802 -0.3 2.4 4.6Sep +4.3 Sep 7.3 5.4 6.9Sep +1.6 Sep 1.4 1.7 6.3015 +2.5Sep 1 2.2 2.7Sep* +52.5Sep na 47.3 9.6Q2* +10.2Sep 3.1 8 13.7Jul* +6.0Sep 4 5.3 3.9Sep +0.7Sep 5.7 3.1 6.6Q2 +5.1 Sep 2.9 4.4 34.402* trade-forex-rate output-price-unemployment
Step by Step Solution
There are 3 Steps involved in it

Get step-by-step solutions from verified subject matter experts