

Question: Please show work in excel if possible. Thank you! A convenience store recently started to carry a new brand of soft drink Management is interested
Please show work in excel if possible. Thank you! 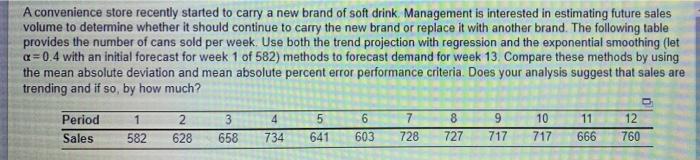
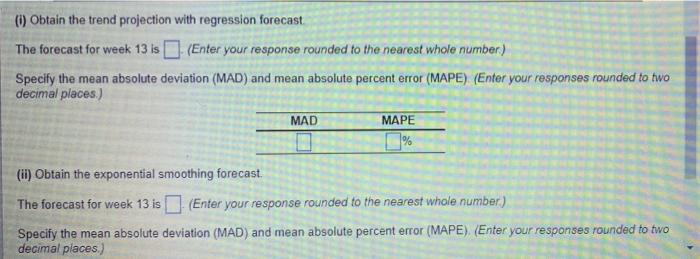
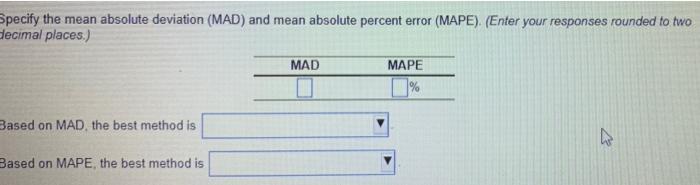
A convenience store recently started to carry a new brand of soft drink Management is interested in estimating future sales volume to determine whether it should continue to carry the new brand or replace it with another brand. The following table provides the number of cans sold per week Use both the trend projection with regression and the exponential smoothing (let a=0.4 with an initial forecast for week 1 of 582) methods to forecast demand for week 13. Compare these methods by using the mean absolute deviation and mean absolute percent error performance criteria Does your analysis suggest that sales are trending and if so, by how much? 4 7 8 9 Period Sales 1 582 2 628 5 641 6 603 10 717 11 666 12. 760 658 734 728 727 717 (1) Obtain the trend projection with regression forecast The forecast for week 13 is (Enter your response rounded to the nearest whole number) Specify the mean absolute deviation (MAD) and mean absolute percent error (MAPE) (Enter your responses rounded to two decimal places) MAD MAPE (ii) obtain the exponential smoothing forecast. The forecast for week 13 is (Enter your response rounded to the nearest whole number) Specify the mean absolute deviation (MAD) and mean absolute percent error (MAPE) (Enter your responses rounded to two decimal places.) Specify the mean absolute deviation (MAD) and mean absolute percent error (MAPE). (Enter your responses rounded to two decimal places.) MAD MAPE % Based on MAD, the best method is 7 Based on MAPE, the best method is
Step by Step Solution
There are 3 Steps involved in it
1 Expert Approved Answer
Step: 1 Unlock

Question Has Been Solved by an Expert!
Get step-by-step solutions from verified subject matter experts
Step: 2 Unlock
Step: 3 Unlock