

Question: please show work on excel 3.(10 Points) Create a number of nonconformities c chart for the provided data. Show your calculations for the centerline and
please show work on excel
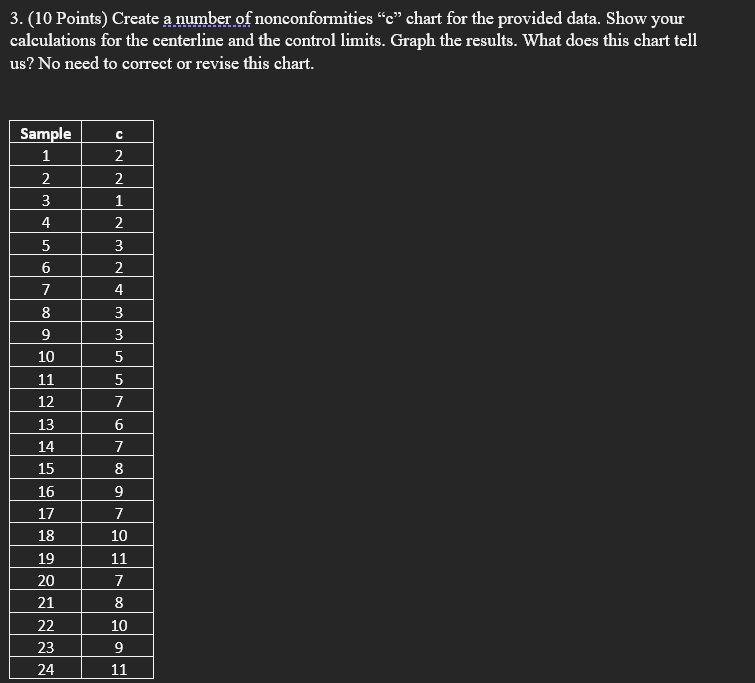
3.(10 Points) Create a number of nonconformities c chart for the provided data. Show your calculations for the centerline and the control limits. Graph the results. What does this chart tell us? No need to correct or revise this chart. Sample 1 2 3 4 NM 2 2 1 2 3 2 4 ww 3 3 5 5 7 56789 6 7 8 9 on 09 o 10 11 12 13 14 15 16 17 18 19 20 21 22 23 24 7 10 11 7 8 10 9 11Step by Step Solution
There are 3 Steps involved in it
1 Expert Approved Answer
Step: 1 Unlock

Question Has Been Solved by an Expert!
Get step-by-step solutions from verified subject matter experts
Step: 2 Unlock
Step: 3 Unlock