

Question: Please show your work step by step. Thanks Question 3 (20 pts) The below chart shows the expected monthly profit or loss of Horizon Company
Please show your work step by step. Thanks
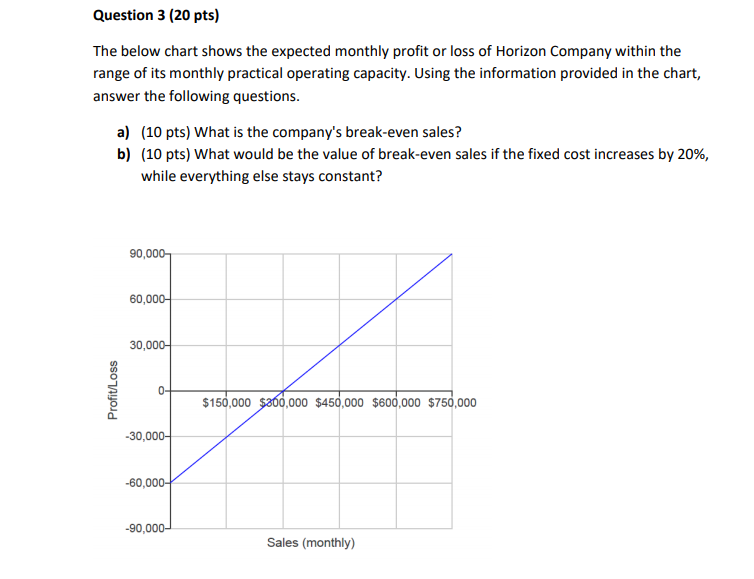
Question 3 (20 pts) The below chart shows the expected monthly profit or loss of Horizon Company within the range of its monthly practical operating capacity. Using the information provided in the chart, answer the following questions. a) (10 pts) What is the company's break-even sales? b) (10 pts) What would be the value of break-even sales if the fixed cost increases by 20%, while everything else stays constant? 90,000 60,000- 30,000 Profit/Loss 0- $150,000 $200,000 $450,000 $600,000 $750,000 -30,000 -60,000- -90,000 Sales (monthly)Step by Step Solution
There are 3 Steps involved in it
1 Expert Approved Answer
Step: 1 Unlock

Question Has Been Solved by an Expert!
Get step-by-step solutions from verified subject matter experts
Step: 2 Unlock
Step: 3 Unlock