

Question: Please solve all, thank you 11. Reference the supply and demand curves for hats mentioned above. Now, assume the government sets oor of $15. a.
Please solve all, thank you
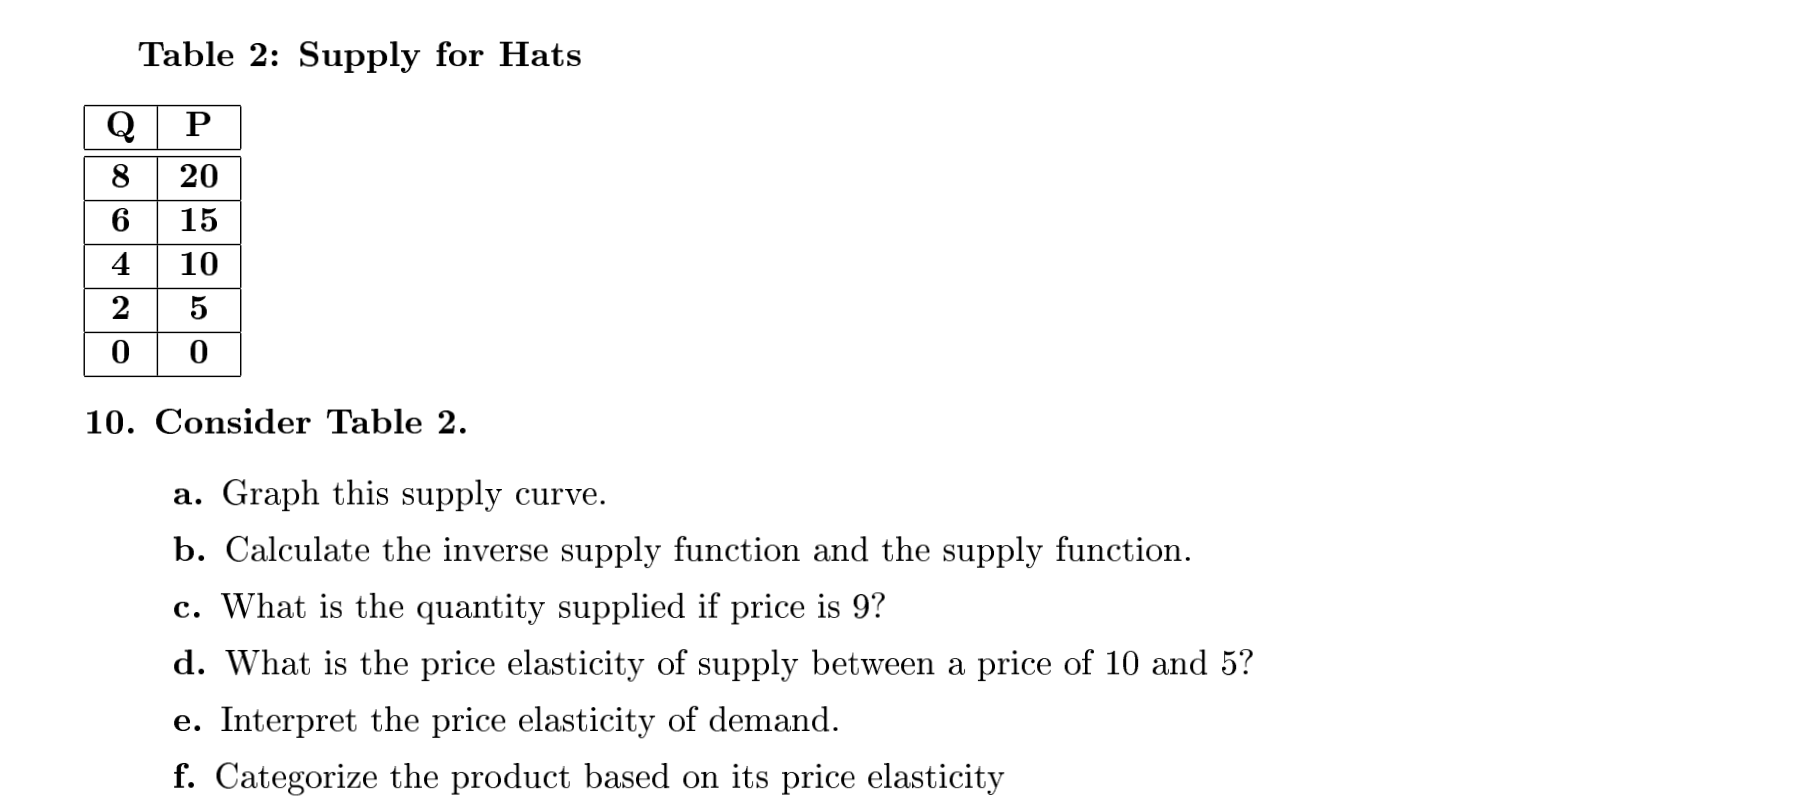
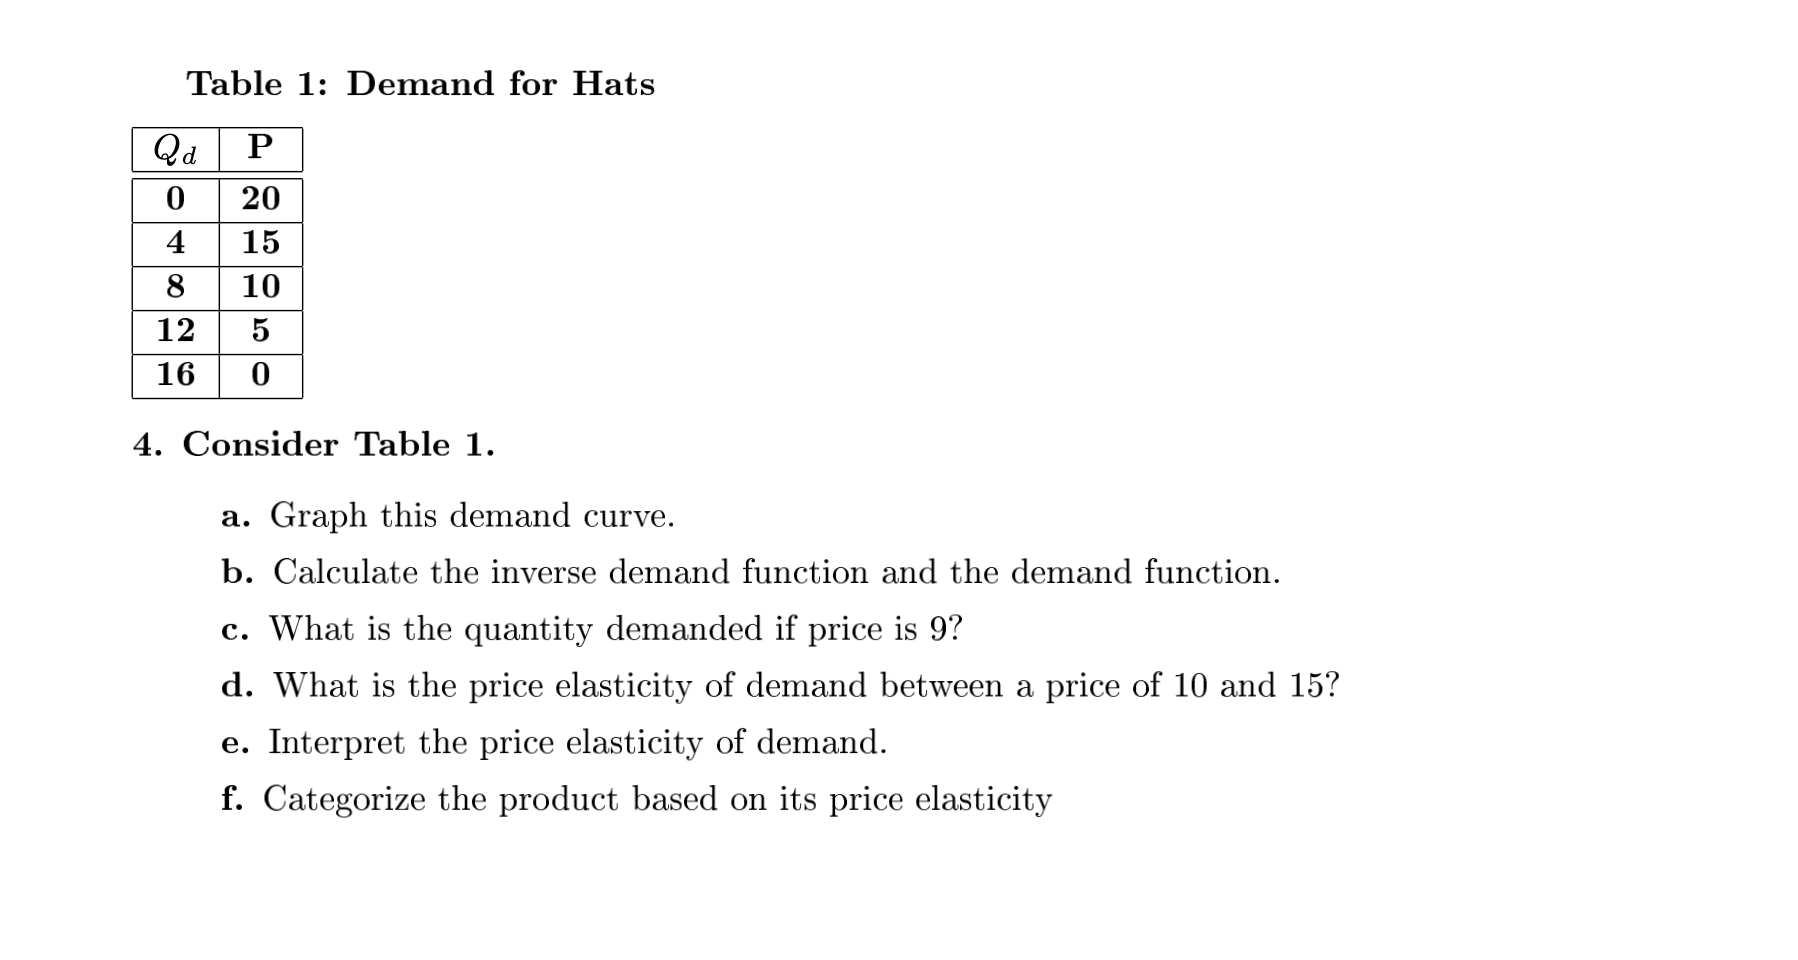
11. Reference the supply and demand curves for hats mentioned above. Now, assume the government sets oor of $15. a. Is this binding? Why? b. How many products are sold? c. Is there a shortage or a surplus? How big is it? Table 2: Supply for Hats Q 10. Consider Table 2. :1. Graph this supply curve. b. Calculate the inverse supply function and the supply function. c. What is the quantity supplied if price is 9? d. What is the price elasticity of supply between a price of 10 and 5? e. Interpret the price elasticity of demand. f. Categorize the product based on its price elasticity Table 1: Demand for Hats 4. Consider Table 1. a. Graph this demand curve. b. Calculate the inverse demand function and the demand function. c. What is the quantity demanded if price is 9? d. What is the price elasticity of demand between a price of 10 and 15? e. Interpret the price elasticity of demand. f. Categorize the product based on its price elasticity
Step by Step Solution
There are 3 Steps involved in it

Get step-by-step solutions from verified subject matter experts