

Question: Q.1. Complete the table and draw the diagrams. Marginal MRPL Revenue MPL Output Elasticity Q APL Wages 1 100 $500 $10 $500 $500 $500
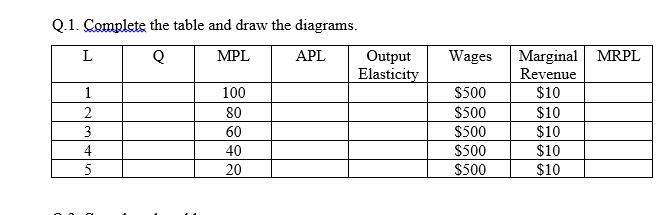
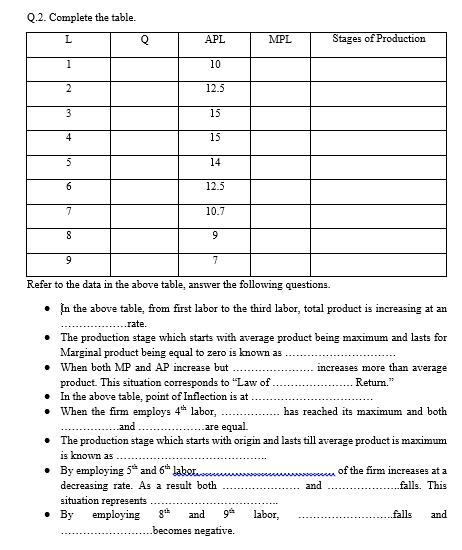
Q.1. Complete the table and draw the diagrams. Marginal MRPL Revenue MPL Output Elasticity Q APL Wages 1 100 $500 $10 $500 $500 $500 80 $10 $10 $10 3 60 4 40 20 $500 $10 Q.2. Complete the table. L Q APL MPL Stages of Production 10 2 12.5 3 15 4 15 14 6. 12.5 7 10.7 9. 7 Refer to the data in the above table, answer the following questions. In the above table, from first labor to the third labor, total product is increasing at an ..rate. The production stage which starts with average product being maximum and lasts for Marginal product being equal to zero is known as When both MP and AP increase but product. This situation corresponds to "Law of. In the above table, point of Inflection is at When the firm employs 4h labor, increases more than average Retum." has reached its maximum and both and ..are equal. The production stage which starts with origin and lasts till average product is maximum is known as By employing 5* and 6* labor. of the firm increases at a decreasing rate. As a result both situation represents and .falls. This By employing and labor, .falls and becomes negative.
Step by Step Solution
There are 3 Steps involved in it
1 To calculate Q Q change in MPL change in L 100 01 0 1001 100 100 80 21 201 20 80 6032 201 20 60404... View full answer

Get step-by-step solutions from verified subject matter experts