

Question: please solve for all yellow cells and show formula Format 3 Merge & Center 347 fx =VLOOKUP(Cat*,G33:136,2, TRUE) 23 LOOKUP Functions 24th when we were
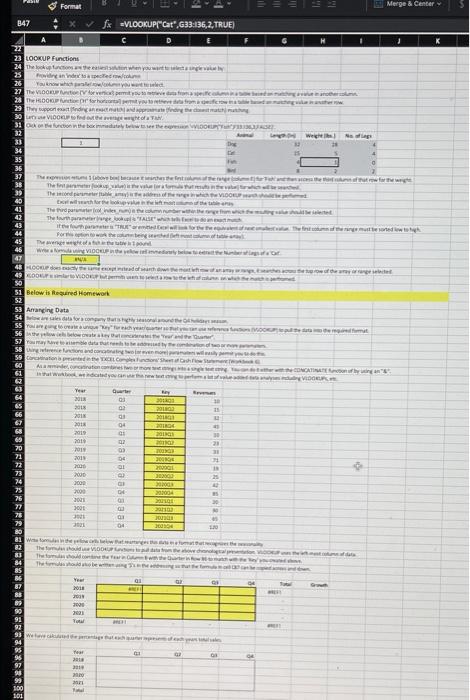
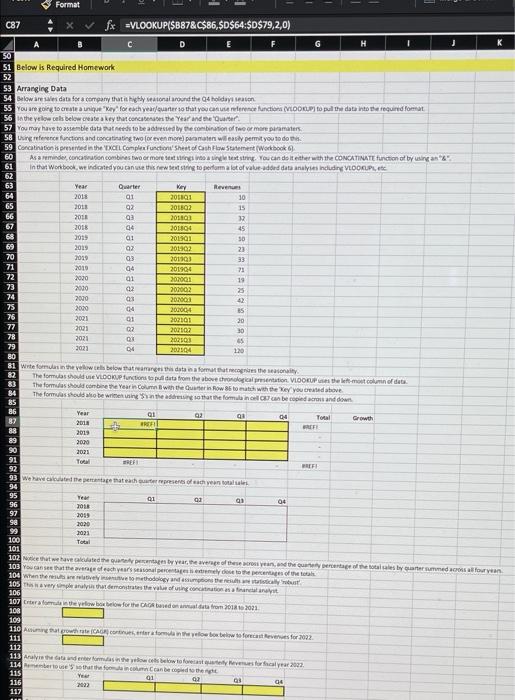
Format 3 Merge & Center 347 fx =VLOOKUP("Cat*,G33:136,2, TRUE) 23 LOOKUP Functions 24th when we were 25 France 26 Ya no te 27THVIDOBIV on perusteet THOOKprforhoort te from 29 The opport and prefer the thing 30 VIEW 31 bete WIDO 22 33 1 34 TO wowa The the . The VIDO work The third par The fourth ewwel fin muilled with 44 For eter 45 The 45 www.VOGEL 47 48 HOUR ut depavalibut 49LVO 30 51 Below is required Homework 52 53 Arvanging Data 54 data for control 33 56 weke 57 mayda to 58greed.com 59 CES he 60 51 In that will you can com VIDO NATI" 61 Year Qur 64 2018 300 65 2018 20 2013 2018 2018 20 30 69 2010 23 20 2011 300 2008 200 3000 20 2000H 3001 20 3001 11 2021 2001 04 30 faa a aa aa aa aa a Was Thu My v 4 l VDEN H Nam H HH Theodor The G 2018 2000 2001 welche Year 97 201 100 101 Format C87 fx =VLOOKUP($887&C$86,$D$64:$D$79,2,0) 2009 Reeeeeeeeeeeeee 202004 3091 A B D E F G H 50 51 Below is Required Homework 52 53 Arranging Data 54 Below are data for a company thata highly eatonal around the 4 holiday season 55 You are going to create a unique way for each year founter so that you can reference funcions (DOCUP to pull data into the required for 56 in the yellow als below create a key that concerns the year and the Quarter 57 You may have to assemble data and to be addressed by the combination of two or more parameters S8 inference fictions and concinating two or even more parts will easily permit you to do this. 59 Conciliation presented in the 'TROL Complex function Shestofth Flow Statement Workbook 60 As a reminder concertin combines two or more beatifitoter. You can do it ether with the CONCATINATE function of by using an "" 61 In that Workbook, we indicated you can use this new sex string to perform a lot of value-added data analyses including VLOOKUPL, 62 63 Year Quarter Key Reven 64 2015 20181 10 65 2011 201802 15 66 2018 OLOT 67 2015 201104 45 68 2015 201301 30 69 2019 201302 23 70 03 201503 33 71 2010 201904 73 72 2020 202001 19 73 2000 202002 25 74 2000 202001 62 75 2020 04 85 76 202101 77 2021 02 200102 30 78 2021 0 202503 55 79 2023 202104 220 80 81 We fouin the well below that mange this data for the only 82 The forms should use VLOOKUP functions to pull data from the above cronologation VLOOKUP the e-match of data 83 The formules should combine Year in Column with the under in How to match with the ey you cred hove 84 The forms should also be written in the address that the formalincalcan be copied across and de 85 86 Year Q1 2 04 Total Growth 87 2018 ERA REF 88 2019 89 2000 So 2023 91 TREFI 92 93 we have called the page that each terms of each year totale 94 95 01 04 96 97 2019 sa 2020 99 2033 100 Total 101 102e that we have calculated the quality year, the average of these rus year, and there of the total sales by carmed cross all four year 103 You can see that the age of each year's eyes to the pages of the 104 win the event methodology and there will 10 lavery analysis that demonstrates the value of using conditions and invit 106 107 rol new how for the AGA based on data from 2013102001 108 109 110 Auguh rate Controle box below to forca Revenues for 2012 112 113 Anal headersheyes blow to forecast for the year 2023 114 St.fo.com Can be the 115 Yes 01 116 02 2022 117 Format 3 Merge & Center 347 fx =VLOOKUP("Cat*,G33:136,2, TRUE) 23 LOOKUP Functions 24th when we were 25 France 26 Ya no te 27THVIDOBIV on perusteet THOOKprforhoort te from 29 The opport and prefer the thing 30 VIEW 31 bete WIDO 22 33 1 34 TO wowa The the . The VIDO work The third par The fourth ewwel fin muilled with 44 For eter 45 The 45 www.VOGEL 47 48 HOUR ut depavalibut 49LVO 30 51 Below is required Homework 52 53 Arvanging Data 54 data for control 33 56 weke 57 mayda to 58greed.com 59 CES he 60 51 In that will you can com VIDO NATI" 61 Year Qur 64 2018 300 65 2018 20 2013 2018 2018 20 30 69 2010 23 20 2011 300 2008 200 3000 20 2000H 3001 20 3001 11 2021 2001 04 30 faa a aa aa aa aa a Was Thu My v 4 l VDEN H Nam H HH Theodor The G 2018 2000 2001 welche Year 97 201 100 101 Format C87 fx =VLOOKUP($887&C$86,$D$64:$D$79,2,0) 2009 Reeeeeeeeeeeeee 202004 3091 A B D E F G H 50 51 Below is Required Homework 52 53 Arranging Data 54 Below are data for a company thata highly eatonal around the 4 holiday season 55 You are going to create a unique way for each year founter so that you can reference funcions (DOCUP to pull data into the required for 56 in the yellow als below create a key that concerns the year and the Quarter 57 You may have to assemble data and to be addressed by the combination of two or more parameters S8 inference fictions and concinating two or even more parts will easily permit you to do this. 59 Conciliation presented in the 'TROL Complex function Shestofth Flow Statement Workbook 60 As a reminder concertin combines two or more beatifitoter. You can do it ether with the CONCATINATE function of by using an "" 61 In that Workbook, we indicated you can use this new sex string to perform a lot of value-added data analyses including VLOOKUPL, 62 63 Year Quarter Key Reven 64 2015 20181 10 65 2011 201802 15 66 2018 OLOT 67 2015 201104 45 68 2015 201301 30 69 2019 201302 23 70 03 201503 33 71 2010 201904 73 72 2020 202001 19 73 2000 202002 25 74 2000 202001 62 75 2020 04 85 76 202101 77 2021 02 200102 30 78 2021 0 202503 55 79 2023 202104 220 80 81 We fouin the well below that mange this data for the only 82 The forms should use VLOOKUP functions to pull data from the above cronologation VLOOKUP the e-match of data 83 The formules should combine Year in Column with the under in How to match with the ey you cred hove 84 The forms should also be written in the address that the formalincalcan be copied across and de 85 86 Year Q1 2 04 Total Growth 87 2018 ERA REF 88 2019 89 2000 So 2023 91 TREFI 92 93 we have called the page that each terms of each year totale 94 95 01 04 96 97 2019 sa 2020 99 2033 100 Total 101 102e that we have calculated the quality year, the average of these rus year, and there of the total sales by carmed cross all four year 103 You can see that the age of each year's eyes to the pages of the 104 win the event methodology and there will 10 lavery analysis that demonstrates the value of using conditions and invit 106 107 rol new how for the AGA based on data from 2013102001 108 109 110 Auguh rate Controle box below to forca Revenues for 2012 112 113 Anal headersheyes blow to forecast for the year 2023 114 St.fo.com Can be the 115 Yes 01 116 02 2022 117
Step by Step Solution
There are 3 Steps involved in it

Get step-by-step solutions from verified subject matter experts