

Question: Please solve in Excel and show which functions were inputted and how to input them 7 Consider the following data which indicates quarter-wise sales for
Please solve in Excel and show which functions were inputted and how to input them
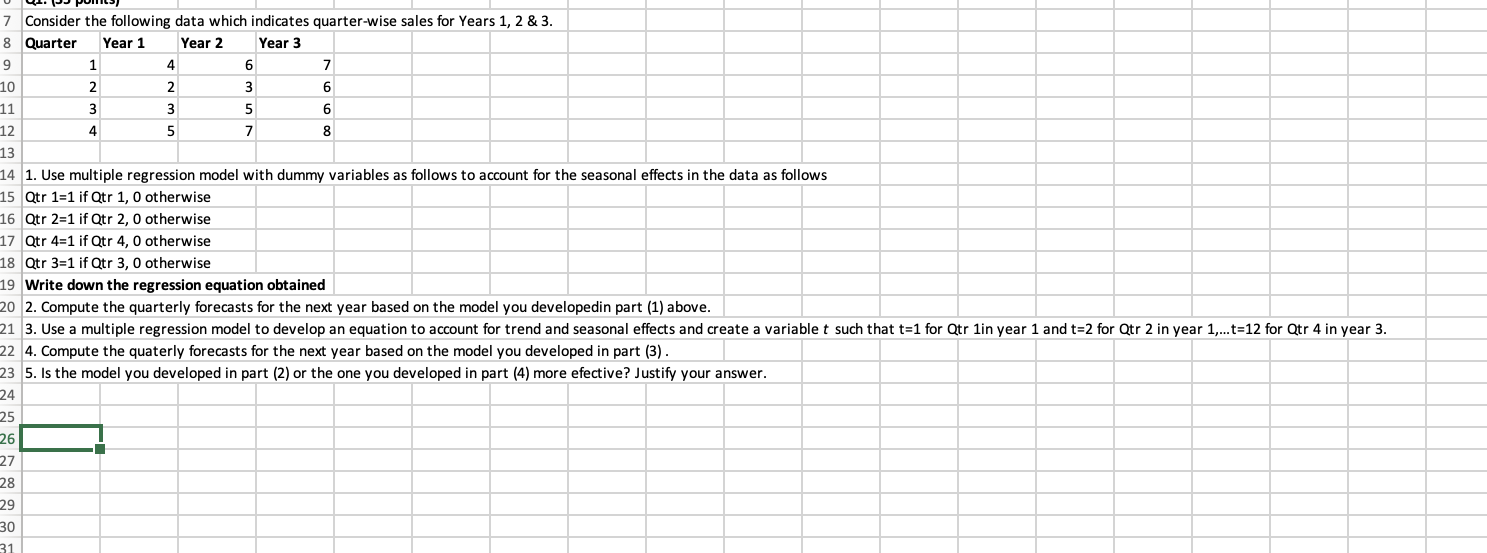
7 Consider the following data which indicates quarter-wise sales for Years 1,2 \& 3 . \begin{tabular}{|l|l|l|l|l|l|} \hline 8 & Quarter & Year 1 & Year 2 & Year 3 \\ \hline 9 & 1 & 4 & 6 & 7 \\ \hline 10 & 2 & 2 & 3 & 6 \\ \hline 11 & 3 & 3 & 5 & 6 \\ \hline 12 & 4 & 5 & 7 & 8 \\ \hline \end{tabular} 1. Use multiple regression model with dummy variables as follows to account for the seasonal effects in the data as follows Qtr 1=1 if Qtr 1, 0 otherwise Qtr 2=1 if Qtr 2, 0 otherwise Qtr 4=1 if Qtr 4, 0 otherwise Write down the regression equation obtained 2. Compute the quarterly forecasts for the next year based on the model you developedin part (1) above. 4. Compute the quaterly forecasts for the next year based on the model you developed in part (3). 5. Is the model you developed in part (2) or the one you developed in part (4) more efective? Justify yourStep by Step Solution
There are 3 Steps involved in it
1 Expert Approved Answer
Step: 1 Unlock

Question Has Been Solved by an Expert!
Get step-by-step solutions from verified subject matter experts
Step: 2 Unlock
Step: 3 Unlock