

Question: Please solve in excel showing all the formula Problem 3: The following table contains annual returns for the stocks of Home Depot (HD) and Lowe's
Please solve in excel showing all the formula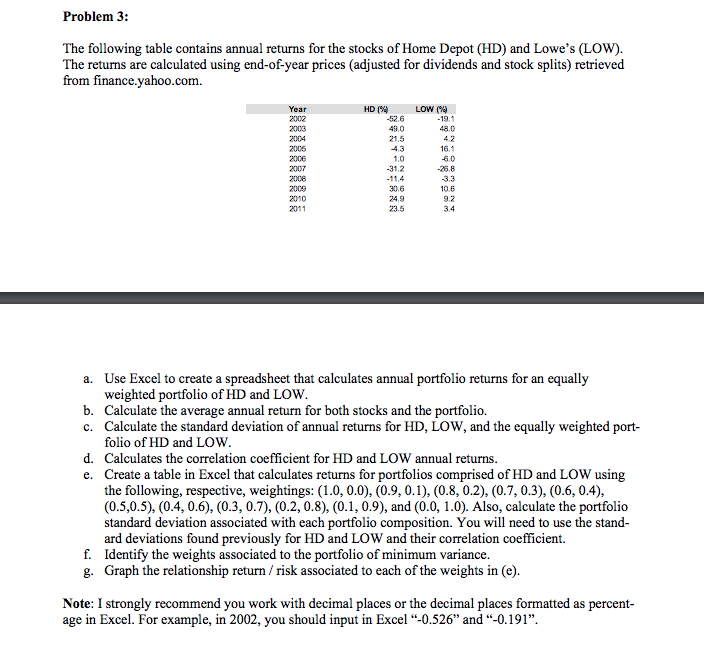
Problem 3: The following table contains annual returns for the stocks of Home Depot (HD) and Lowe's (LOW). The returns are calculated using end-of-year prices adjusted for dividends and stock splits) retrieved from finance.yahoo.com. Year HD 19 -52.6 LOW (99 - 19.1 42 16.1 60 2002 2003 2004 2005 2006 2007 2008 2009 2010 2011 21.5 43 1.0 -31.2 -11,4 30.6 24,9 23.5 3.3 10.6 92 3.4 a. Use Excel to create a spreadsheet that calculates annual portfolio returns for an equally weighted portfolio of HD and LOW. b. Calculate the average annual return for both stocks and the portfolio. c. Calculate the standard deviation of annual returns for HD, LOW, and the equally weighted port- folio of HD and LOW. d. Calculates the correlation coefficient for HD and LOW annual returns. e. Create a table in Excel that calculates returns for portfolios comprised of HD and LOW using the following, respective, weightings: (1.0, 0.0), (0.9,0.1), (0.8,0.2), (0.7, 0.3), (0.6, 0.4), (0.5,0.5), (0.4, 0.6), (0.3, 0.7), (0.2, 0.8), (0.1,0.9), and (0.0, 1.0). Also, calculate the portfolio standard deviation associated with each portfolio composition. You will need to use the stand- ard deviations found previously for HD and LOW and their correlation coefficient. f. Identify the weights associated to the portfolio of minimum variance. g. Graph the relationship return / risk associated to each of the weights in (e). Note: I strongly recommend you work with decimal places or the decimal places formatted as percent- age in Excel. For example, in 2002, you should input in Excel -0.526" and "-0.191
Step by Step Solution
There are 3 Steps involved in it

Get step-by-step solutions from verified subject matter experts