

Question: Please solve it Problem 4 MRH Exercise 2-26. Skip the cumulative frequency plots. Just do frequency his- tograms like the in-class examples. You may use
Please solve it
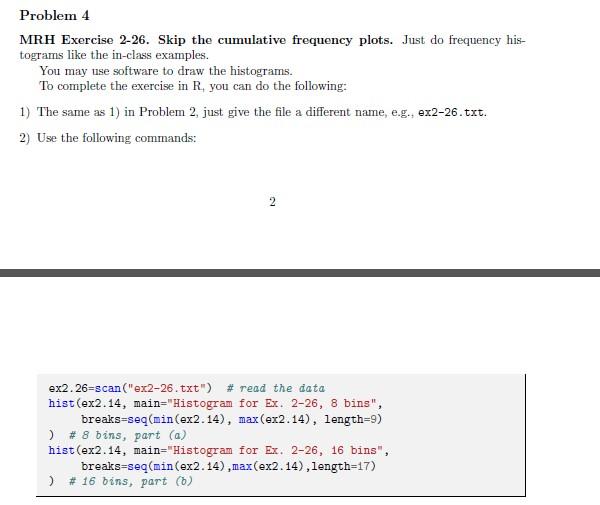
Problem 4 MRH Exercise 2-26. Skip the cumulative frequency plots. Just do frequency his- tograms like the in-class examples. You may use software to draw the histograms. To complete the exercise in R, you can do the following: 1) The same as 1) in Problem 2, just give the file a different name, e.g. ex2-26.txt. 2) Use the following commands: 2 ex2.26=scan ("ex2-26.txt") # read the data hist(ex2.14, main="Histogram for Ex. 2-26, 8 bins", breaks-seq(min(ex2.14), max (ex2.14), length=9) ) # 8 bins, part (a) hist(ex2.14, main="Histogram for Ex. 2-26, 16 bins", breaks=seq(min (ex2.14),max(ex2.14), length=17) ) # 16 bins, part (0) Problem 4 MRH Exercise 2-26. Skip the cumulative frequency plots. Just do frequency his- tograms like the in-class examples. You may use software to draw the histograms. To complete the exercise in R, you can do the following: 1) The same as 1) in Problem 2, just give the file a different name, e.g. ex2-26.txt. 2) Use the following commands: 2 ex2.26=scan ("ex2-26.txt") # read the data hist(ex2.14, main="Histogram for Ex. 2-26, 8 bins", breaks-seq(min(ex2.14), max (ex2.14), length=9) ) # 8 bins, part (a) hist(ex2.14, main="Histogram for Ex. 2-26, 16 bins", breaks=seq(min (ex2.14),max(ex2.14), length=17) ) # 16 bins, part (0)
Step by Step Solution
There are 3 Steps involved in it

Get step-by-step solutions from verified subject matter experts