

Question: Please solve it provide deatial answer 3. The following table shows the amount of good A and good B that two countries could produce if
Please solve it provide deatial answer
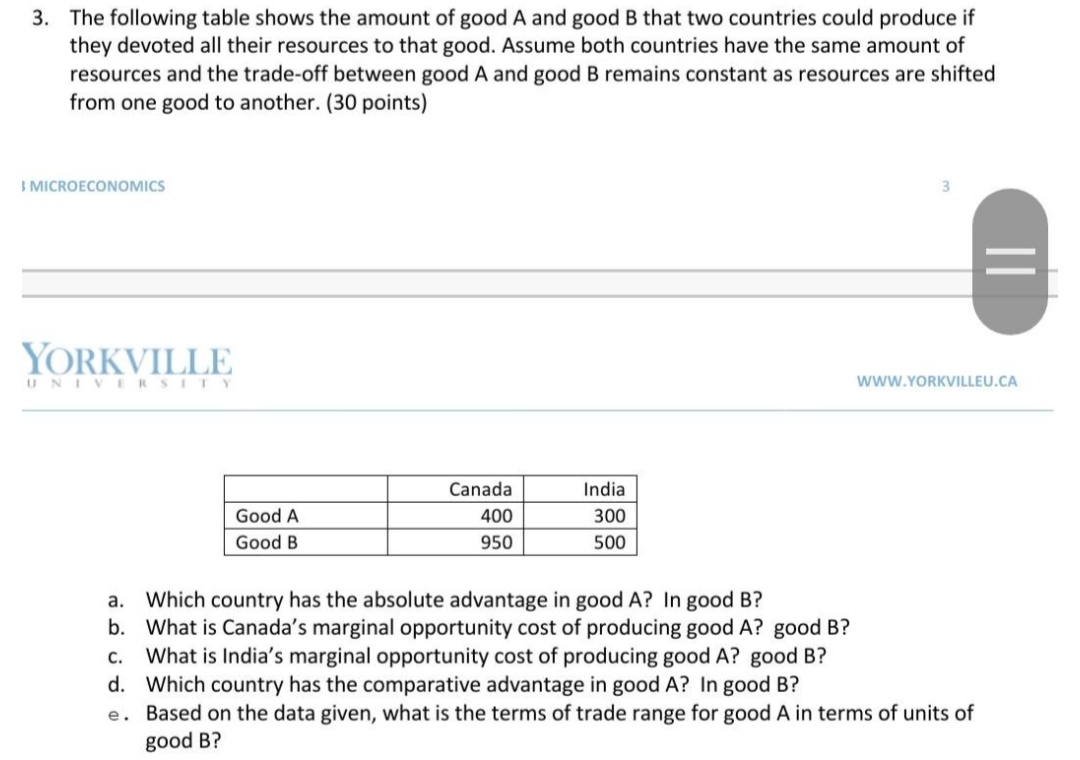
3. The following table shows the amount of good A and good B that two countries could produce if they devoted all their resources to that good. Assume both countries have the same amount of resources and the trade-off between good A and good B remains constant as resources are shifted from one good to another. (30 points) IMICRDECONDMICS Y( )RKYI l .1 .1-'. ii '\\ r x I ll ~ I I m WWW.'I'0RKUILLEU.CA m mm -lm Which country has the absolute advantage In good A? In good B? What is Canada's marginal opportunity cost of producing good A? good B? What is india's marginal opportunity cost of producing good A? good B? Which country has the comparative advantage in good A? In good B? . Based on the data given, what is the terms of trade range for good A in terms of units of good B? the-oar.\
Step by Step Solution
There are 3 Steps involved in it

Get step-by-step solutions from verified subject matter experts