

Question: please solve part 2 and what woukd me the new MAD and MAPE A convenience store recently started to carry a new brand of soft
please solve part 2 and what woukd me the new MAD and MAPE 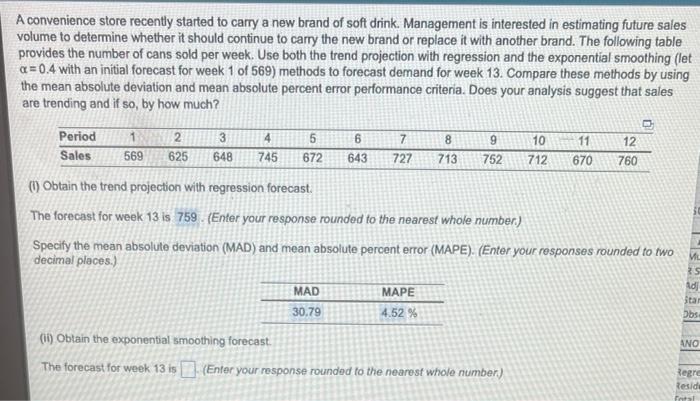
A convenience store recently started to carry a new brand of soft drink. Management is interested in estimating future sales volume to determine whether it should continue to carry the new brand or replace it with another brand. The following table provides the number of cans sold per week. Use both the trend projection with regression and the exponential smoothing (let a=0.4 with an initial forecast for week 1 of 569) methods to forecast demand for week 13. Compare these methods by using the mean absolute deviation and mean absolute percent error performance criteria. Does your analysis suggest that sales are trending and if so, by how much? Period Sales 1 2 569 625 3 648 4 745 7 8 5 6 672 643 727 713 MAD 30.79 9 752 MAPE 4.52% 10 712 (1) Obtain the trend projection with regression forecast. The forecast for week 13 is 759 (Enter your response rounded to the nearest whole number.) Specify the mean absolute deviation (MAD) and mean absolute percent error (MAPE). (Enter your responses rounded to two decimal places.) (ii) Obtain the exponential smoothing forecast. The forecast for week 13 is (Enter your response rounded to the nearest whole number) 11 670 12 760 Mu 5 Ad Sta Obs ANO Regre Reside Fotal
Step by Step Solution
There are 3 Steps involved in it
1 Expert Approved Answer
Step: 1 Unlock

Question Has Been Solved by an Expert!
Get step-by-step solutions from verified subject matter experts
Step: 2 Unlock
Step: 3 Unlock