Question: this is my last question and second time asking this one, as the first chegg tutor got it wrong. if you could please read everything

this is my last question and second time asking this one, as the first chegg tutor got it wrong. if you could please read everything carefully and get the correct answer that would make my day! lol this is my last question and second time asking
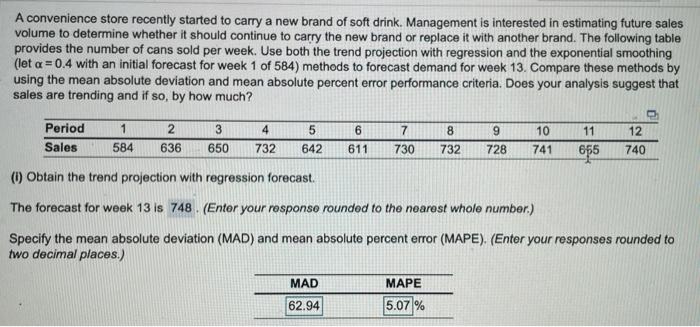
you will be solving for the MAD and the MAPE
A convenience store recently started to carry a new brand of soft drink. Management is interested in estimating future sales volume to determine whether it should continue to carry the new brand or replace it with another brand. The following table provides the number of cans sold per week. Use both the trend projection with regression and the exponential smoothing (let a = 0.4 with an initial forecast for week 1 of 584) methods to forecast demand for week 13. Compare these methods by using the mean absolute deviation and mean absolute percent error performance criteria. Does your analysis suggest that sales are trending and if so, by how much? 6 7 9 10 11 Period Sales 1 584 2 636 3 650 4 732 5 642 8 732 12 740 611 730 728 741 656 (1) Obtain the trend projection with regression forecast. The forecast for week 13 is 748 . (Enter your response rounded to the nearest whole number.) Specify the mean absolute deviation (MAD) and mean absolute percent error (MAPE). (Enter your responses rounded to two decimal places.) MAD MAPE 62.94 5.07%

Step by Step Solution

There are 3 Steps involved in it

1 Expert Approved Answer
Step: 1 Unlock blur-text-image
Question Has Been Solved by an Expert!

Get step-by-step solutions from verified subject matter experts

Step: 2 Unlock
Step: 3 Unlock

Students Have Also Explored These Related General Management Questions!