Question: please solve the 4 questions by using minitab Exercise An article by L. B. Hare, Journal of Quality Technology 1988 (Vol. 20, pp. 36-43) described
please solve the 4 questions by using minitab
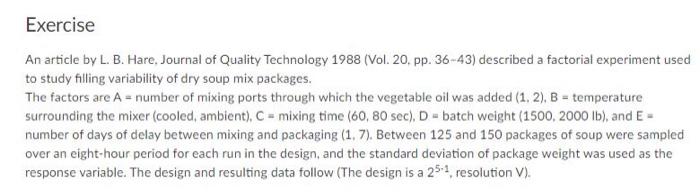
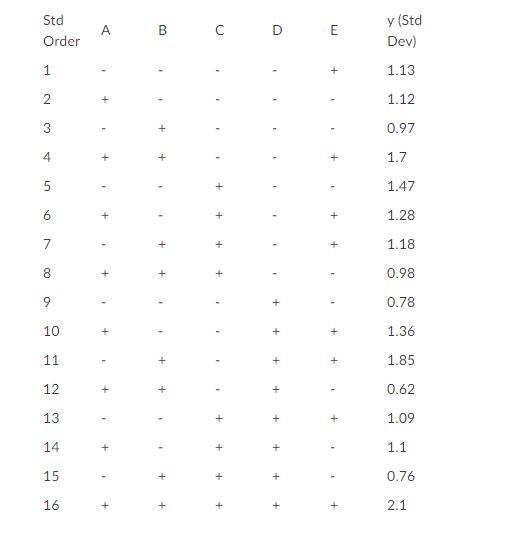
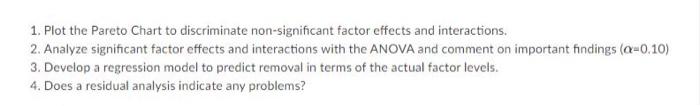
Exercise An article by L. B. Hare, Journal of Quality Technology 1988 (Vol. 20, pp. 36-43) described a factorial experiment used to study filling variability of dry soup mix packages. The factors are A = number of mixing ports through which the vegetable oil was added (1, 2), B = temperature surrounding the mixer (cooled, ambient), C = mixing time (60, 80 sec), D-batch weight (1500, 2000 lb), and E = number of days of delay between mixing and packaging (1,7). Between 125 and 150 packages of soup were sampled over an eight-hour period for each run in the design, and the standard deviation of package weight was used as the response variable. The design and resulting data follow (The design is a 25-1 resolution V). Std Order A B y (Std Dev) 1 - - 1.13 2 2 + 1.12 3 + 0.97 4 + + 1.7 5 - + 1.47 6 + + 1.28 7 - + + 1.18 8 + + - 0.98 9 - - + 0.78 10 + + 1.36 11 + 1.85 12 + + + 0.62 13 - - + + 1.09 14 + + + 1.1 15 + + 0.76 16 + + + + + 2.1 1. Plot the Pareto Chart to discriminate non-significant factor effects and interactions. 2. Analyze significant factor effects and interactions with the ANOVA and comment on important findings (-0,10) 3. Develop a regression model to predict removal in terms of the actual factor levels. 4. Does a residual analysis indicate any problems? Exercise An article by L. B. Hare, Journal of Quality Technology 1988 (Vol. 20, pp. 36-43) described a factorial experiment used to study filling variability of dry soup mix packages. The factors are A = number of mixing ports through which the vegetable oil was added (1, 2), B = temperature surrounding the mixer (cooled, ambient), C = mixing time (60, 80 sec), D-batch weight (1500, 2000 lb), and E = number of days of delay between mixing and packaging (1,7). Between 125 and 150 packages of soup were sampled over an eight-hour period for each run in the design, and the standard deviation of package weight was used as the response variable. The design and resulting data follow (The design is a 25-1 resolution V). Std Order A B y (Std Dev) 1 - - 1.13 2 2 + 1.12 3 + 0.97 4 + + 1.7 5 - + 1.47 6 + + 1.28 7 - + + 1.18 8 + + - 0.98 9 - - + 0.78 10 + + 1.36 11 + 1.85 12 + + + 0.62 13 - - + + 1.09 14 + + + 1.1 15 + + 0.76 16 + + + + + 2.1 1. Plot the Pareto Chart to discriminate non-significant factor effects and interactions. 2. Analyze significant factor effects and interactions with the ANOVA and comment on important findings (-0,10) 3. Develop a regression model to predict removal in terms of the actual factor levels. 4. Does a residual analysis indicate any problems