

Question: Please solve this problem based on the instructions. And please do not use already answered directions from chegg, because they do not work. Replicate the
Please solve this problem based on the instructions. And please do not use already answered directions from chegg, because they do not work.
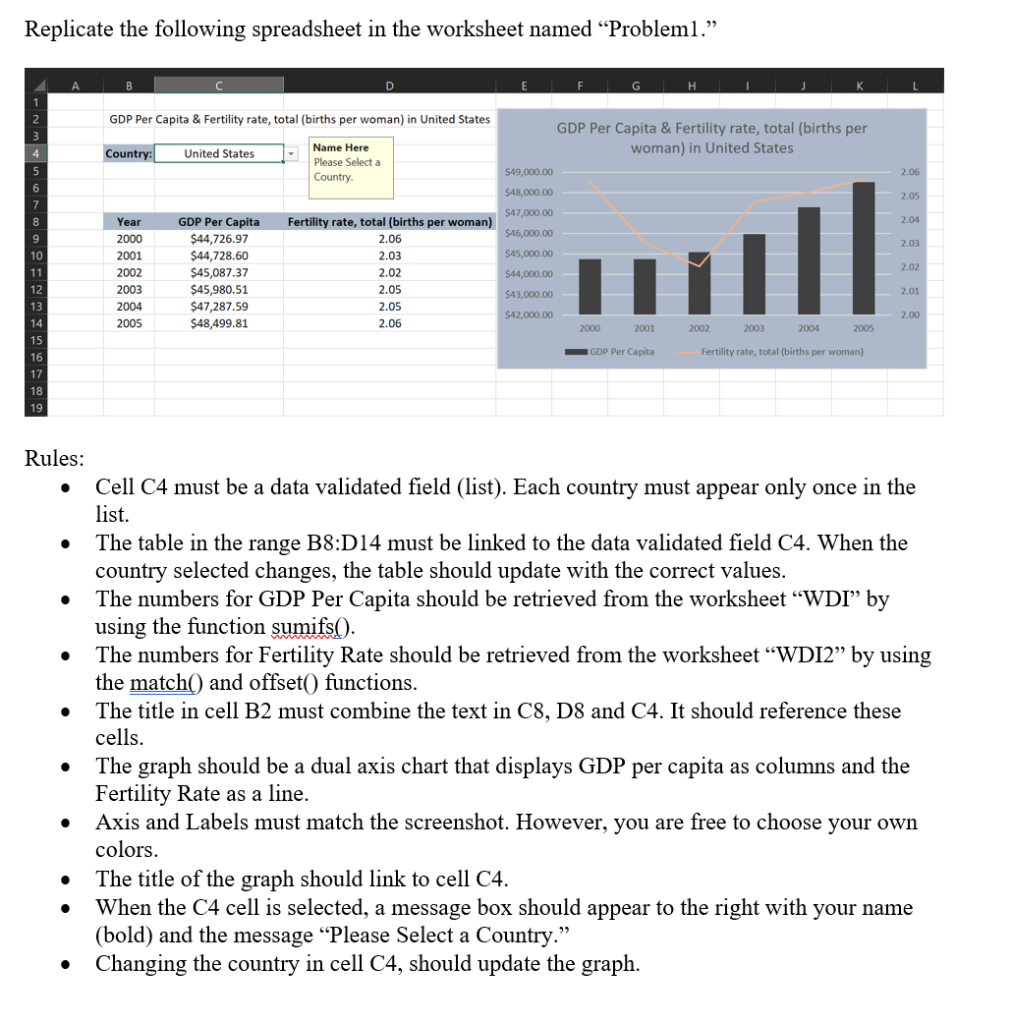
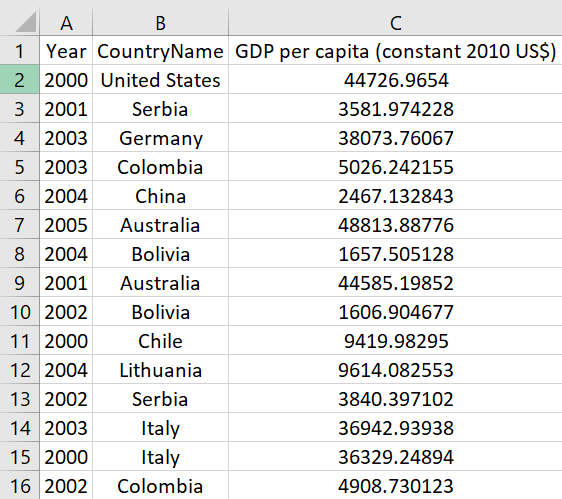
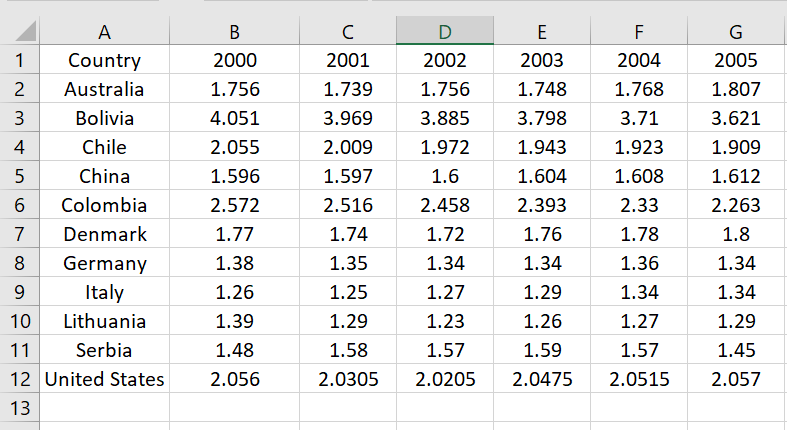
Replicate the following spreadsheet in the worksheet named Probleml. D GDP Per Capita & Fertility rate, total (births per woman) in United States GDP Per Capita & Fertility rate, total (births per woman) in United States Country: United States Name Here Please Select a Country $49,000.00 2.06 $48,000.00 2.05 $47,000.00 2.04 8 9 $46,000.00 2.03 $45,000.00 2.02 Year 2000 2001 2002 2003 2004 2005 10 11 12 13 GDP Per Capita $44,726.97 $44,728.60 $45,087.37 $45,980.51 $47,287.59 $48,499.81 Fertility rate, total (births per woman) 2.06 2.03 2.02 2.05 2.05 2.06 $44.000.00 $43,000.00 2.01 $42,000.00 2.00 14 2000 2001 2002 2003 2004 2005 GDP Per Capita Fertility rate, total (births per woman) 15 16 17 18 19 . Rules: Cell C4 must be a data validated field (list). Each country must appear only once in the list. The table in the range B8:D14 must be linked to the data validated field C4. When the country selected changes, the table should update with the correct values. The numbers for GDP Per Capita should be retrieved from the worksheet WDI by using the function sumifs(). The numbers for Fertility Rate should be retrieved from the worksheet WDI2 by using the match() and offset() functions. The title in cell B2 must combine the text in C8, D8 and C4. It should reference these cells. The graph should be a dual axis chart that displays GDP per capita as columns and the Fertility Rate as a line. Axis and Labels must match the screenshot. However, you are free to choose your own colors. The title of the graph should link to cell C4. When the C4 cell is selected, a message box should appear to the right with your name (bold) and the message Please Select a Country. Changing the country in cell C4, should update the graph. A B Year CountryName GDP per capita (constant 2010 US$) 2 2000 United States 44726.9654 3 2001 Serbia 3581.974228 4 2003 Germany 38073.76067 5 2003 Colombia 5026.242155 6 2004 China 2467.132843 7 2005 Australia 48813.88776 8 2004 Bolivia 1657.505128 9 2001 Australia 44585.19852 10 2002 Bolivia 1606.904677 11 2000 Chile 9419.98295 12 2004 Lithuania 9614.082553 13 2002 Serbia 3840.397102 14 2003 Italy 36942.93938 15 2000 Italy 36329.24894 16 2002 Colombia 4908.730123 A 1 Country 2. Australia 3 Bolivia 4 Chile 5 China 6 Colombia 7 Denmark 8 Germany 9 Italy 10 Lithuania 11 Serbia 12 United States 13 B 2000 1.756 4.051 2.055 1.596 2.572 1.77 1.38 1.26 1.39 1.48 2.056 2001 1.739 3.969 2.009 1.597 2.516 1.74 1.35 1.25 1.29 1.58 2.0305 D 2002 1.756 3.885 1.972 1.6 2.458 1.72 1.34 1.27 1.23 1.57 2.0205 E 2003 1.748 3.798 1.943 1.604 2.393 1.76 1.34 1.29 1.26 1.59 2.0475 F 2004 1.768 3.71 1.923 1.608 2.33 1.78 1.36 1.34 1.27 1.57 2.0515 G 2005 1.807 3.621 1.909 1.612 2.263 1.8 1.34 1.34 1.29 1.45 2.057Step by Step Solution
There are 3 Steps involved in it
1 Expert Approved Answer
Step: 1 Unlock

Question Has Been Solved by an Expert!
Get step-by-step solutions from verified subject matter experts
Step: 2 Unlock
Step: 3 Unlock