

Question: Please Solve using excel and show equations: Two mutually exclusive alternatives are being compared. The planning horizon is 10 years, and MARR is 12 percent.
Please Solve using excel and show equations:
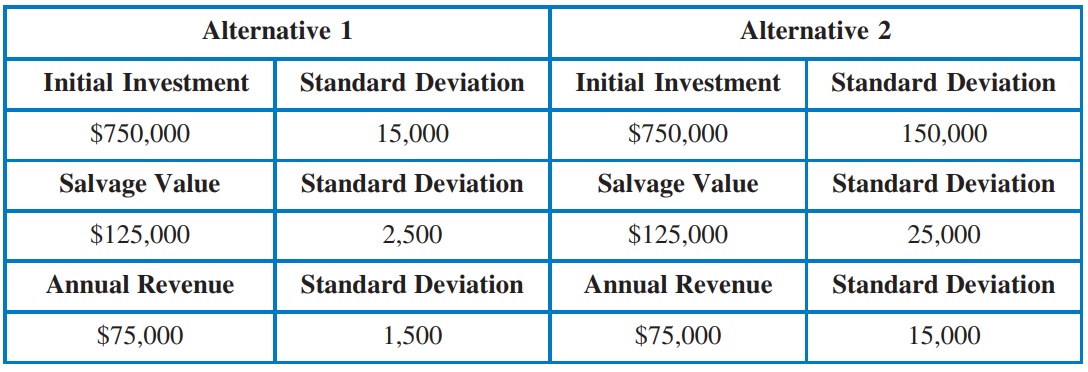
Two mutually exclusive alternatives are being compared. The planning horizon is 10 years, and MARR is 12 percent. The cash flows for the alternatives are shown in the table below. All cash flows are normally distributed.
 For the following questions, determine a simulation solution using Excel: a. Using a Latin hypercube simulation with 10,000 iterations, determine the mean and standard deviation of the present worth of each alternative.
b. Using a Latin hypercube simulation with 10,000 iterations, determine the probability that Alternative 1 is preferred over Alternative 2
\begin{tabular}{|c|c|c|c|} \hline \multicolumn{2}{|c|}{ Alternative 1 } & \multicolumn{2}{c|}{ Alternative 2 } \\ \hline Initial Investment & Standard Deviation & Initial Investment & Standard Deviation \\ \hline$750,000 & 15,000 & $750,000 & 150,000 \\ \hline Salvage Value & Standard Deviation & Salvage Value & Standard Deviation \\ \hline$125,000 & 2,500 & $125,000 & 25,000 \\ \hline Annual Revenue & Standard Deviation & Annual Revenue & Standard Deviation \\ \hline$75,000 & 1,500 & $75,000 & 15,000 \\ \hline \end{tabular} \begin{tabular}{|c|c|c|c|} \hline \multicolumn{2}{|c|}{ Alternative 1 } & \multicolumn{2}{c|}{ Alternative 2 } \\ \hline Initial Investment & Standard Deviation & Initial Investment & Standard Deviation \\ \hline$750,000 & 15,000 & $750,000 & 150,000 \\ \hline Salvage Value & Standard Deviation & Salvage Value & Standard Deviation \\ \hline$125,000 & 2,500 & $125,000 & 25,000 \\ \hline Annual Revenue & Standard Deviation & Annual Revenue & Standard Deviation \\ \hline$75,000 & 1,500 & $75,000 & 15,000 \\ \hline \end{tabular}
Step by Step Solution
There are 3 Steps involved in it

Get step-by-step solutions from verified subject matter experts