

Question: ****PLEASE SOLVE WITH IT ONLY MANUEL.**** ****PLEASE SOLVE WITH IT ONLY MANUEL.**** The number of nonconforming switches in samples of size 150 are shown in
****PLEASE SOLVE WITH IT ONLY MANUEL.****
****PLEASE SOLVE WITH IT ONLY MANUEL.****
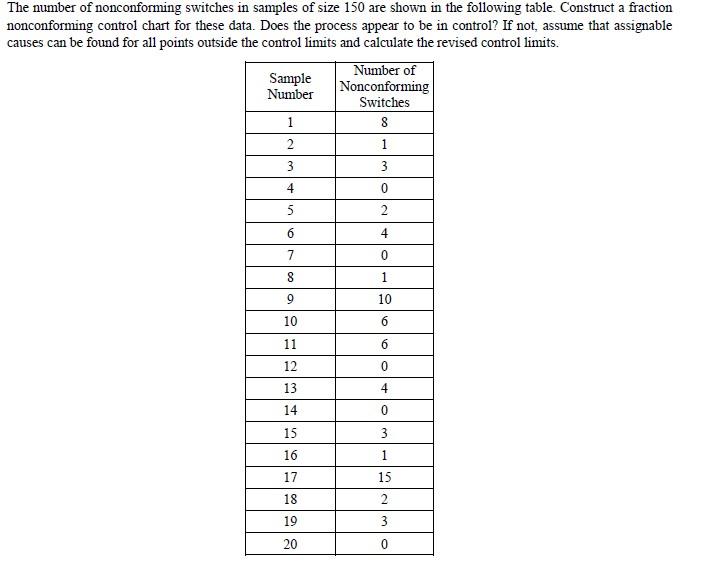
The number of nonconforming switches in samples of size 150 are shown in the following table. Construct a fraction nonconforming control chart for these data. Does the process appear to be in control? If not, assume that assignable causes can be found for all points outside the control limits and calculate the revised control limits. Number of Sample Number Nonconforming Switches 1 8 2 1 3 3 4 0 5 2 4 6 7 8 0 1 9 10 6 10 11 6 12 0 13 4 14 0 3 15 16 1 17 18 15 2 3 1918 20 0Step by Step Solution
There are 3 Steps involved in it
1 Expert Approved Answer
Step: 1 Unlock

Question Has Been Solved by an Expert!
Get step-by-step solutions from verified subject matter experts
Step: 2 Unlock
Step: 3 Unlock