

Question: Please submit the answer as an EXCEL FILE with charts, graphs and histograms in the file as well. DO NOT submit the answer as text
Please submit the answer as an EXCEL FILE with charts, graphs and histograms in the file as well. DO NOT submit the answer as text only.
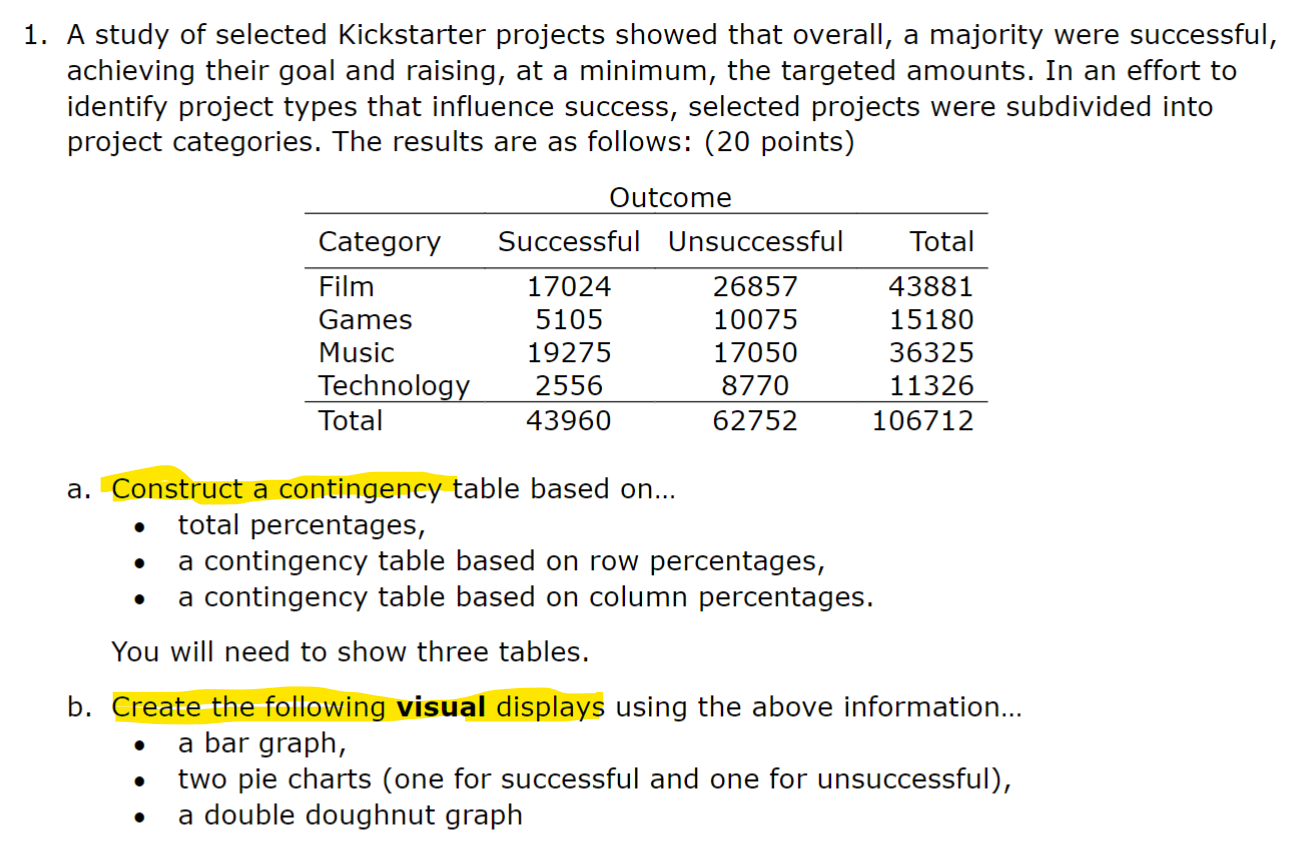
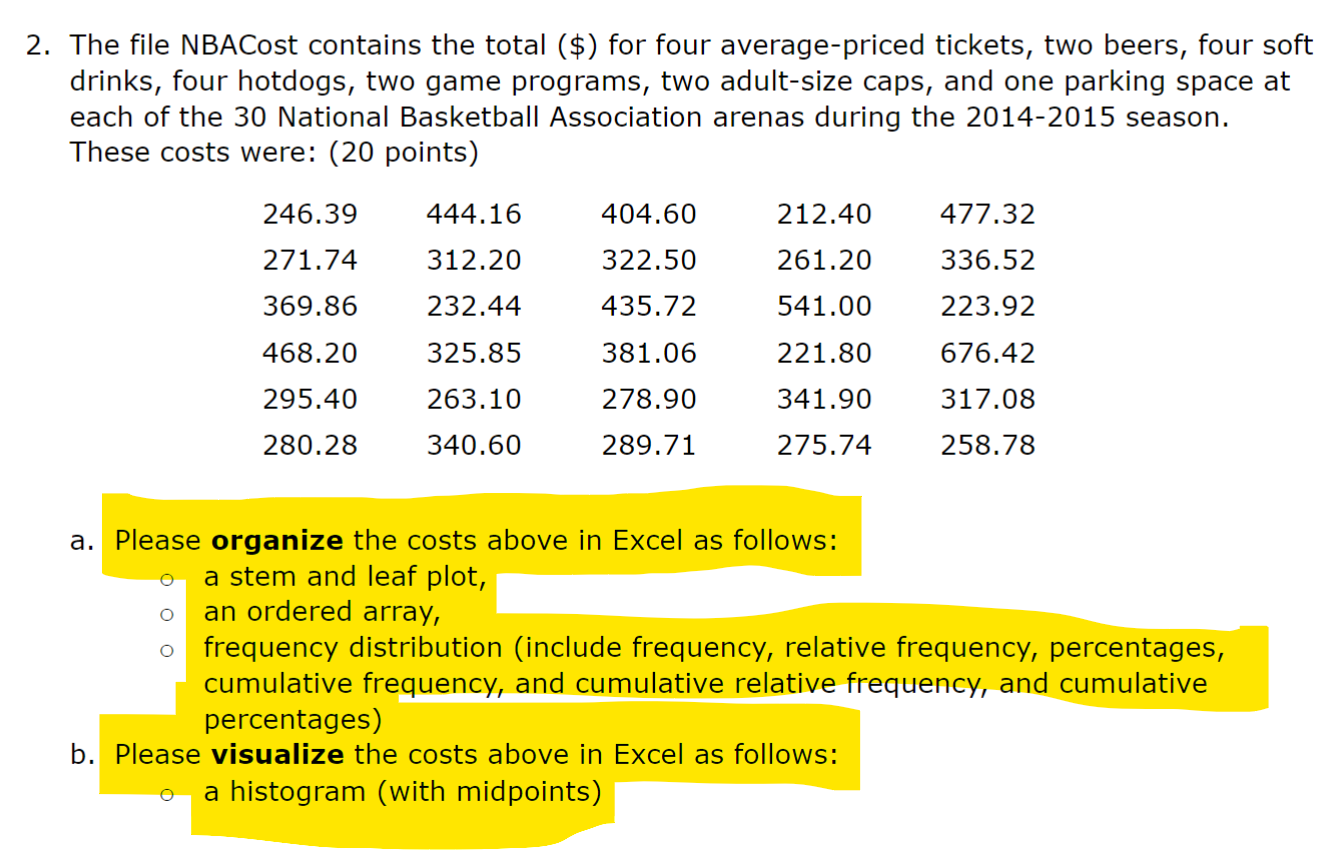
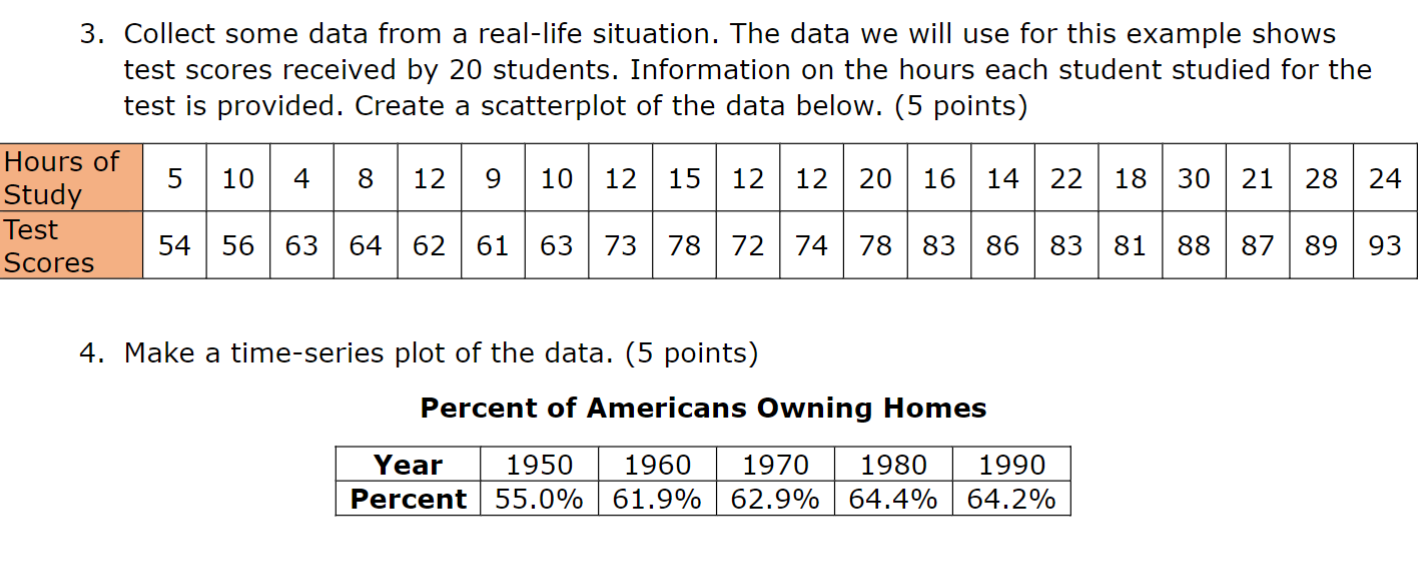
1. A study of selected Kickstarter projects showed that overall, a majority were successful, achieving their goal and raising, at a minimum, the targeted amounts. In an effort to identify project types that influence success, selected projects were subdivided into project categories. The results are as follows: (20 points) Outcome Category Successful Unsuccessful Total Film 17024 26857 43881 Games 5105 10075 15180 Music 19275 17050 36325 Technology 2556 8770 11326 Total 43960 62752 106712 a. Construct a contingency table based on... o total percentages, e a contingency table based on row percentages, e a contingency table based on column percentages. You will need to show three tables. b. Create the following visual displays using the above information... e a bar graph, e two pie charts (one for successful and one for unsuccessful), e a double doughnut graph 2. The file NBACost contains the total ($) for four average-priced tickets, two beers, four soft drinks, four hotdogs, two game programs, two adult-size caps, and one parking space at each of the 30 National Basketball Association arenas during the 2014-2015 season. These costs were: (20 points) 246.39 444.16 404.60 212.40 477.32 271.74 312.20 322.50 261.20 336.92 369.86 232.44 435.72 541.00 223.92 468.20 325.85 381.06 221.80 676.42 295.40 263.10 278.90 341.90 317.08 280.28 340.60 289.71 275.74 258.78 a. Please organize the costs above in Excel as follows: o a stem and leaf plot, o an ordered array, o frequency distribution (include frequency, relative frequency, percentages, cumulative frequency, and cumulative relative frequency, and cumulative percentages) b. Please visualize the costs above in Excel as follows: o a histogram (with midpoints) 3. Collect some data from a real-life situation. The data we will use for this example shows test scores received by 20 students. Information on the hours each student studied for the test is provided. Create a scatterplot of the data below. (5 points) gt"lfg\"f 5 (10| 4 | 8|12 9 |10|12|15|12|12|20|16|14|22|18|30|21 |28/ 24 Test Scores 4. Make a time-series plot of the data. (5 points) Percent of Americans Owning Homes Year 1950 | 1960 | 1970 | 1980 | 1990 Percent | 55.0% | 61.9% | 62.9% | 64.4% | 64.2%
Step by Step Solution
There are 3 Steps involved in it

Get step-by-step solutions from verified subject matter experts