

Question: Please take your time to complete these questions!!! Question 1: The string shown in the figure is driven at a frequency of 5.00 Hz. The
Please take your time to complete these questions!!!
Question 1:
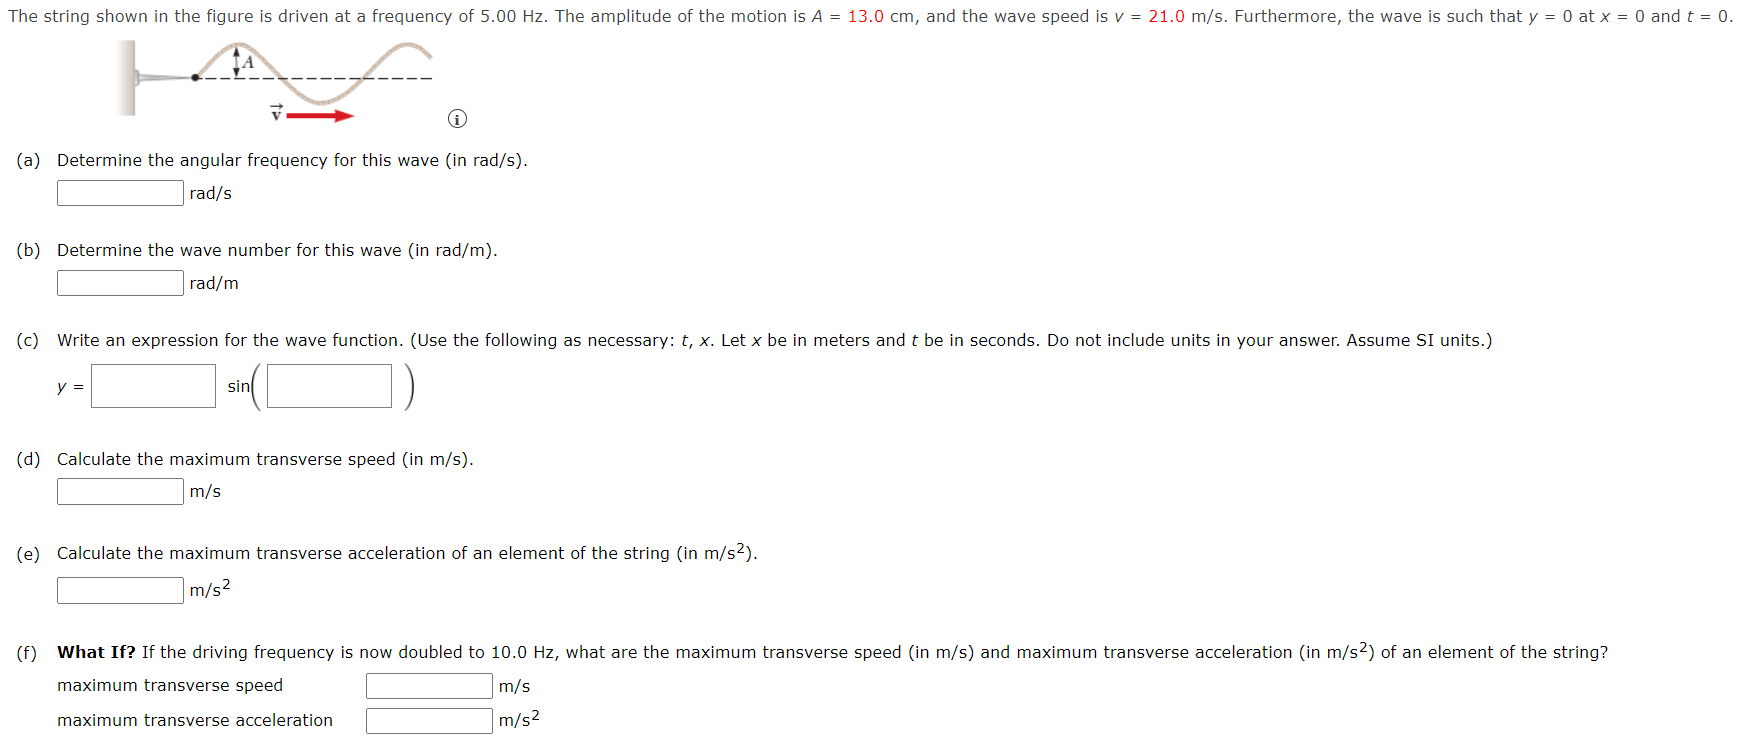
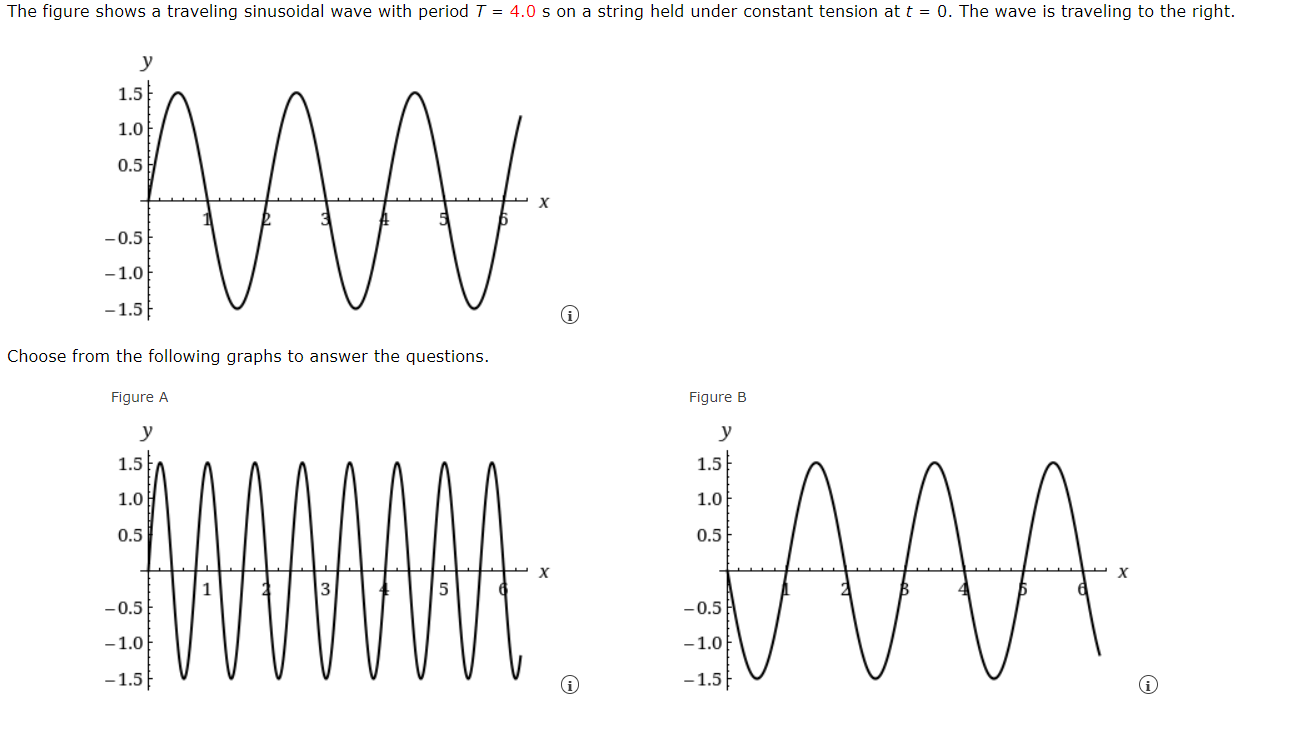
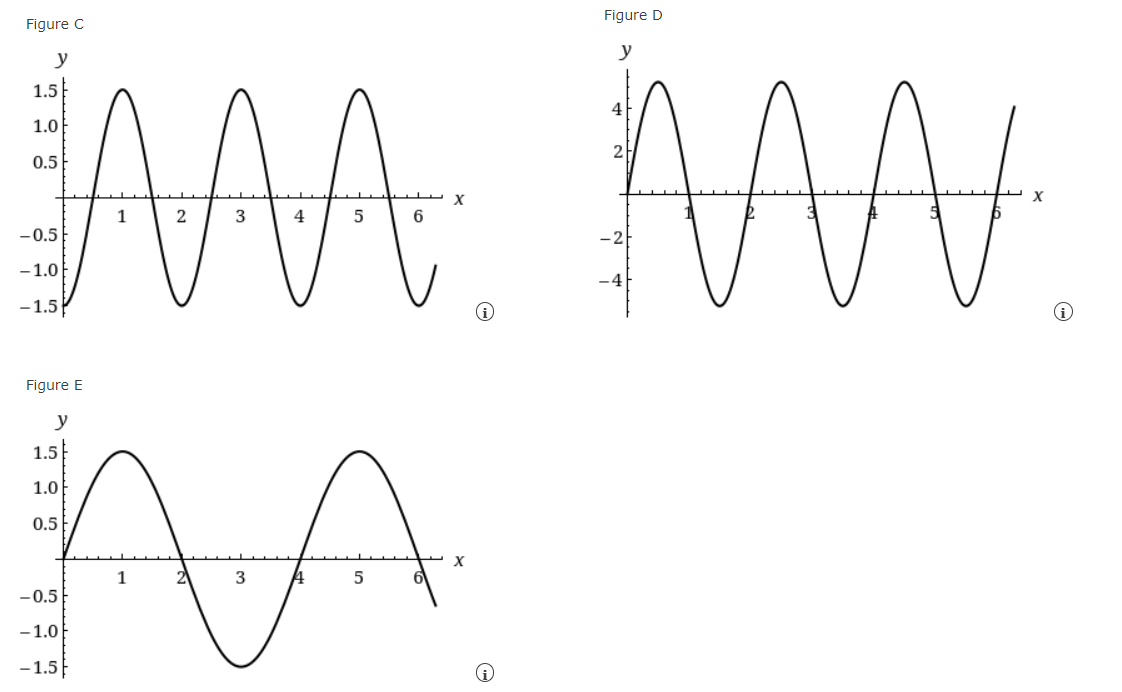
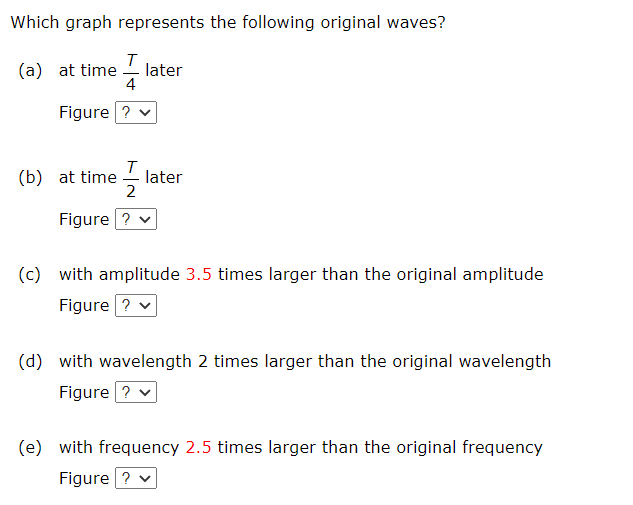
The string shown in the figure is driven at a frequency of 5.00 Hz. The amplitude of the motion is A = 13.0 cm, and the wave speed is v = 21.0 m/s. Furthermore, the wave is such that y = 0 at x = 0 and t = 0. (a) Determine the angular frequency for this wave (in rad/s). rad/s (b) Determine the wave number for this wave (in rad/m). rad/m (c) Write an expression for the wave function. (Use the following as necessary: t, x. Let x be in meters and t be in seconds. Do not include units in your answer. Assume SI units.) (d) Calculate the maximum transverse speed (in m/s). m/s (e) Calculate the maximum transverse acceleration of an element of the string (in m/s2). m/s2 (f ) What If? If the driving frequency is now doubled to 10.0 Hz, what are the maximum transverse speed (in m/s) and maximum transverse acceleration (in m/s2) of an element of the string? maximum transverse speed m/s maximum transverse acceleration m/s2A sound wave propagates in air at 30C with frequency 3.40 kHz. It passes through a region where the temperature gradually changes, and then it moves through air at 0C. (a) What happens to the speed of the wave? 0 The speed decreases because of the decrease in the air's density. 0 The speed increases because of the decrease in the air's density. 0 The speed decreases because of the increase in the air's density. 0 The speed increases because of the increase in the air's density. 0 The speed remains unchanged. What is the speed of the wave at 0C? Em (b) What happens to its frequency? 0 The frequency increases with the decrease in temperature. 0 The frequency decreases with the decrease in temperature. 0 The frequency remains unchanged. What is the frequency of the wave at 0C? (c) What happens to its wavelength? 0 The wavelength increases because the wave crests are closer together. 0 The wavelength increases because the wave crests are further apart. 0 The wavelength remains unchanged. 0 The wavelength decreases because the wave crests are further apart. 0 The wavelength decreases because the wave crests are closer together: What is the wavelength of the wave at 0C? |:|m Two transverse sinusoidal waves combining in a medium are described by the wave functions 1 = 5.00 sin It(x + 0.500t) Y2 = 5.00 sin n(x - 0.500t) where x, y, and y, are in centimeters and t is in seconds. Determine the maximum transverse position of an element of the medium at the following positions. (a) x = 0.110 cm ly max! = cm (b) x = 0.640 cm ly max! = cm (c) x = 1.30 cm ly max! = cm (d) Find the three smallest values of x corresponding to antinodes. (Enter your answers from smallest to largest.) cm cm cmA 52.0 cm long cord is vibrating in such a manner that it forms a standing wave with two antinodes. (The cord is xed at both ends.) (a) Which harmonic does this wave represent? 0 first harmonic 0 second harmonic 0 third harmonic O fourth harmonic 0 none of the above (b) Determine the wavelength (in cm) of this wave. :0. (c) How many nodes are there in the wave pattern? 01 02 O3 04 0 none of the above (d) What If? If the cord has a linear mass density of 0.00526 kg/m and is vibrating at a frequency of 329.6 Hz, determine the tension {in N) in the cord. :N The figure shows a traveling sinusoidal wave with period T = 4.0 s on a string held under constant tension at t = 0. The wave is traveling to the right. J' 1.5 1.0 0.5 X 0.5 1.0 1.5 6) Choose from the following graphs to answer the questions. FIgUI'e A Figure B J' .V 1.5 1.5 1.0 1.0 0.5 0.5 X X 1 5 -0.5 0.5 1.0 1.0 1.5 G) 1.5 G) \fWhich graph represents the following original waves? (a) at time I later 4 Figure {b} at time I later 2 Figure (c) with amplitude 3.5 times larger than the original amplitude Figure {d} with wavelength 2 times larger than the original wavelength Figure (e) with frequency 2.5 times larger than the original frequency Figure
Step by Step Solution
There are 3 Steps involved in it

Get step-by-step solutions from verified subject matter experts