

Question: please try to explain throughly thank you Sales data for two years are as follows. Data are aggregated with two months of sales in each
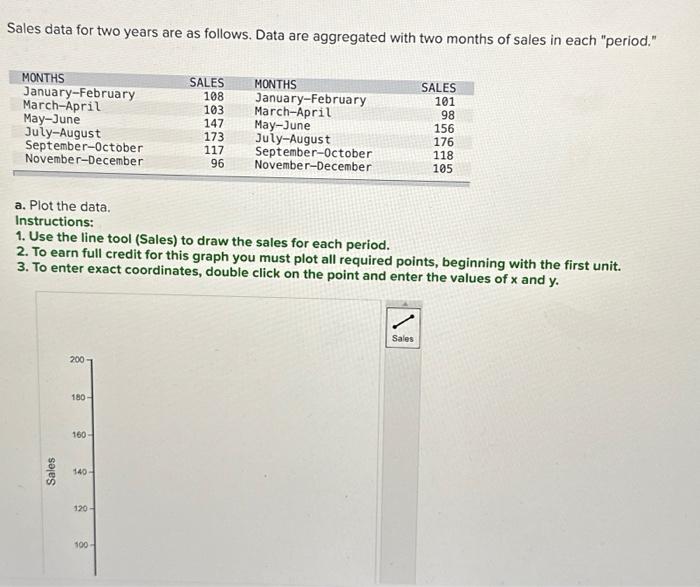
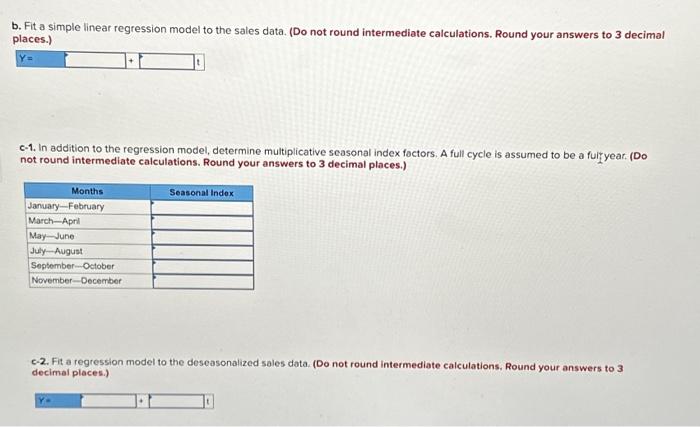
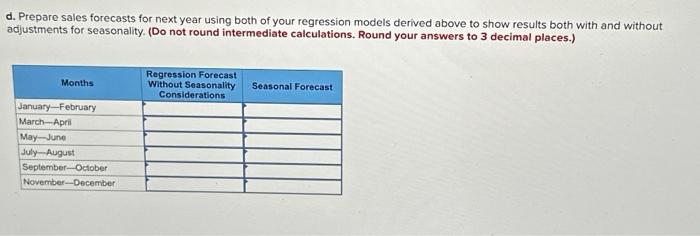
Sales data for two years are as follows. Data are aggregated with two months of sales in each "period." a. Plot the data. Instructions: 1. Use the line tool (Sales) to draw the sales for each period. 2. To earn full credit for this graph you must plot all required points, beginning with the first unit. 3. To enter exact coordinates, double click on the point and enter the values of x and y. b. Fit a simple linear regression model to the sales data. (Do not round intermediate calculations. Round your answers to 3 decimal places.) c-1. In addition to the regression model, determine multiplicative seasonal index foctors. A full cycle is assumed to be a fulizyear. (Do not round intermediate calculations. Round your answers to 3 decimal places.) c-2. Fit a regression model to the deseasonalized sales data. (Do not round intermediate calculations, Round your answers to 3 decimal places.) d. Prepare sales forecasts for next year using both of your regression models derived above to show results both with and without adjustments for seasonality. (Do not round intermediate calculations. Round your answers to 3 decimal places.) Sales data for two years are as follows. Data are aggregated with two months of sales in each "period." a. Plot the data. Instructions: 1. Use the line tool (Sales) to draw the sales for each period. 2. To earn full credit for this graph you must plot all required points, beginning with the first unit. 3. To enter exact coordinates, double click on the point and enter the values of x and y. b. Fit a simple linear regression model to the sales data. (Do not round intermediate calculations. Round your answers to 3 decimal places.) c-1. In addition to the regression model, determine multiplicative seasonal index foctors. A full cycle is assumed to be a fulizyear. (Do not round intermediate calculations. Round your answers to 3 decimal places.) c-2. Fit a regression model to the deseasonalized sales data. (Do not round intermediate calculations, Round your answers to 3 decimal places.) d. Prepare sales forecasts for next year using both of your regression models derived above to show results both with and without adjustments for seasonality. (Do not round intermediate calculations. Round your answers to 3 decimal places.)
Step by Step Solution
There are 3 Steps involved in it

Get step-by-step solutions from verified subject matter experts