

Question: Please type a response. General Data Given the following data, with a specification of 10 +/-2, determine the followin 1. Upper and lower control limits
Please type a response.
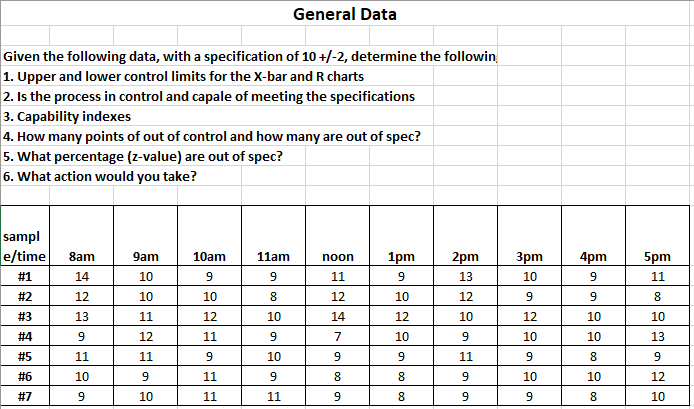
General Data Given the following data, with a specification of 10 +/-2, determine the followin 1. Upper and lower control limits for the X-bar and R charts 2. Is the process in control and capale of meeting the specifications 3. Capability indexes 4. How many points of out of control and how many are out of spec? 5. What percentage (z-value) are out of spec? 6. What action would you take? sampl e/time #1 8am 14 9am 10 10am 9 11am 9 noon 11 1pm 9 2pm 13 3pm 10 4pm 9 5pm 11 #2 12 10 10 8 12 10 12 9 9 8 #3 13 11 12 10 14 12 10 12 10 10 #4 9 12 11 9 7 10 9 10 10 13 #5 11 11 9 10 9 9 11 9 8 9 #6 10 9 11 9 8 8 9 10 10 12 #7 9 10 11 11 9 8 9 9 8 10Step by Step Solution
There are 3 Steps involved in it
1 Expert Approved Answer
Step: 1 Unlock

Question Has Been Solved by an Expert!
Get step-by-step solutions from verified subject matter experts
Step: 2 Unlock
Step: 3 Unlock