

Question 7 The diagram below shows the demand for money and the supply of the money. 7.1
Fantastic news! We've Found the answer you've been seeking!
Question:
Question 7
The diagram below shows the demand for money and the supply of the money.
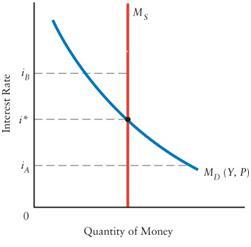
7.1 Explain why the MD function is downward sloping.
7.2 Suppose the interest rate is at iA. Explain how firms and households attempt to satisfy their excess demand for money. What is the effect of their actions?
7.3 Suppose the interest rate is at iB. Explain how firms and households attempt to satisfy their excess demand for money. What is the effect of their actions?
7.4 Now suppose there is an increase in the transactions demand for money (perhaps because of growth in real GDP). Beginning at i*, explain what happens in the money market. How is this shown in the diagram?
Expert Answer:
1 Function Md slope indicates that as interest rate decreases the supply of money increases because ... View the full answer

Related Book For 

Posted Date:
