

Question: Please use a graphing paper for the part that needed it but the other one that is written could be in a white paper PART
Please use a graphing paper for the part that needed it but the other one that is written could be in a white paper
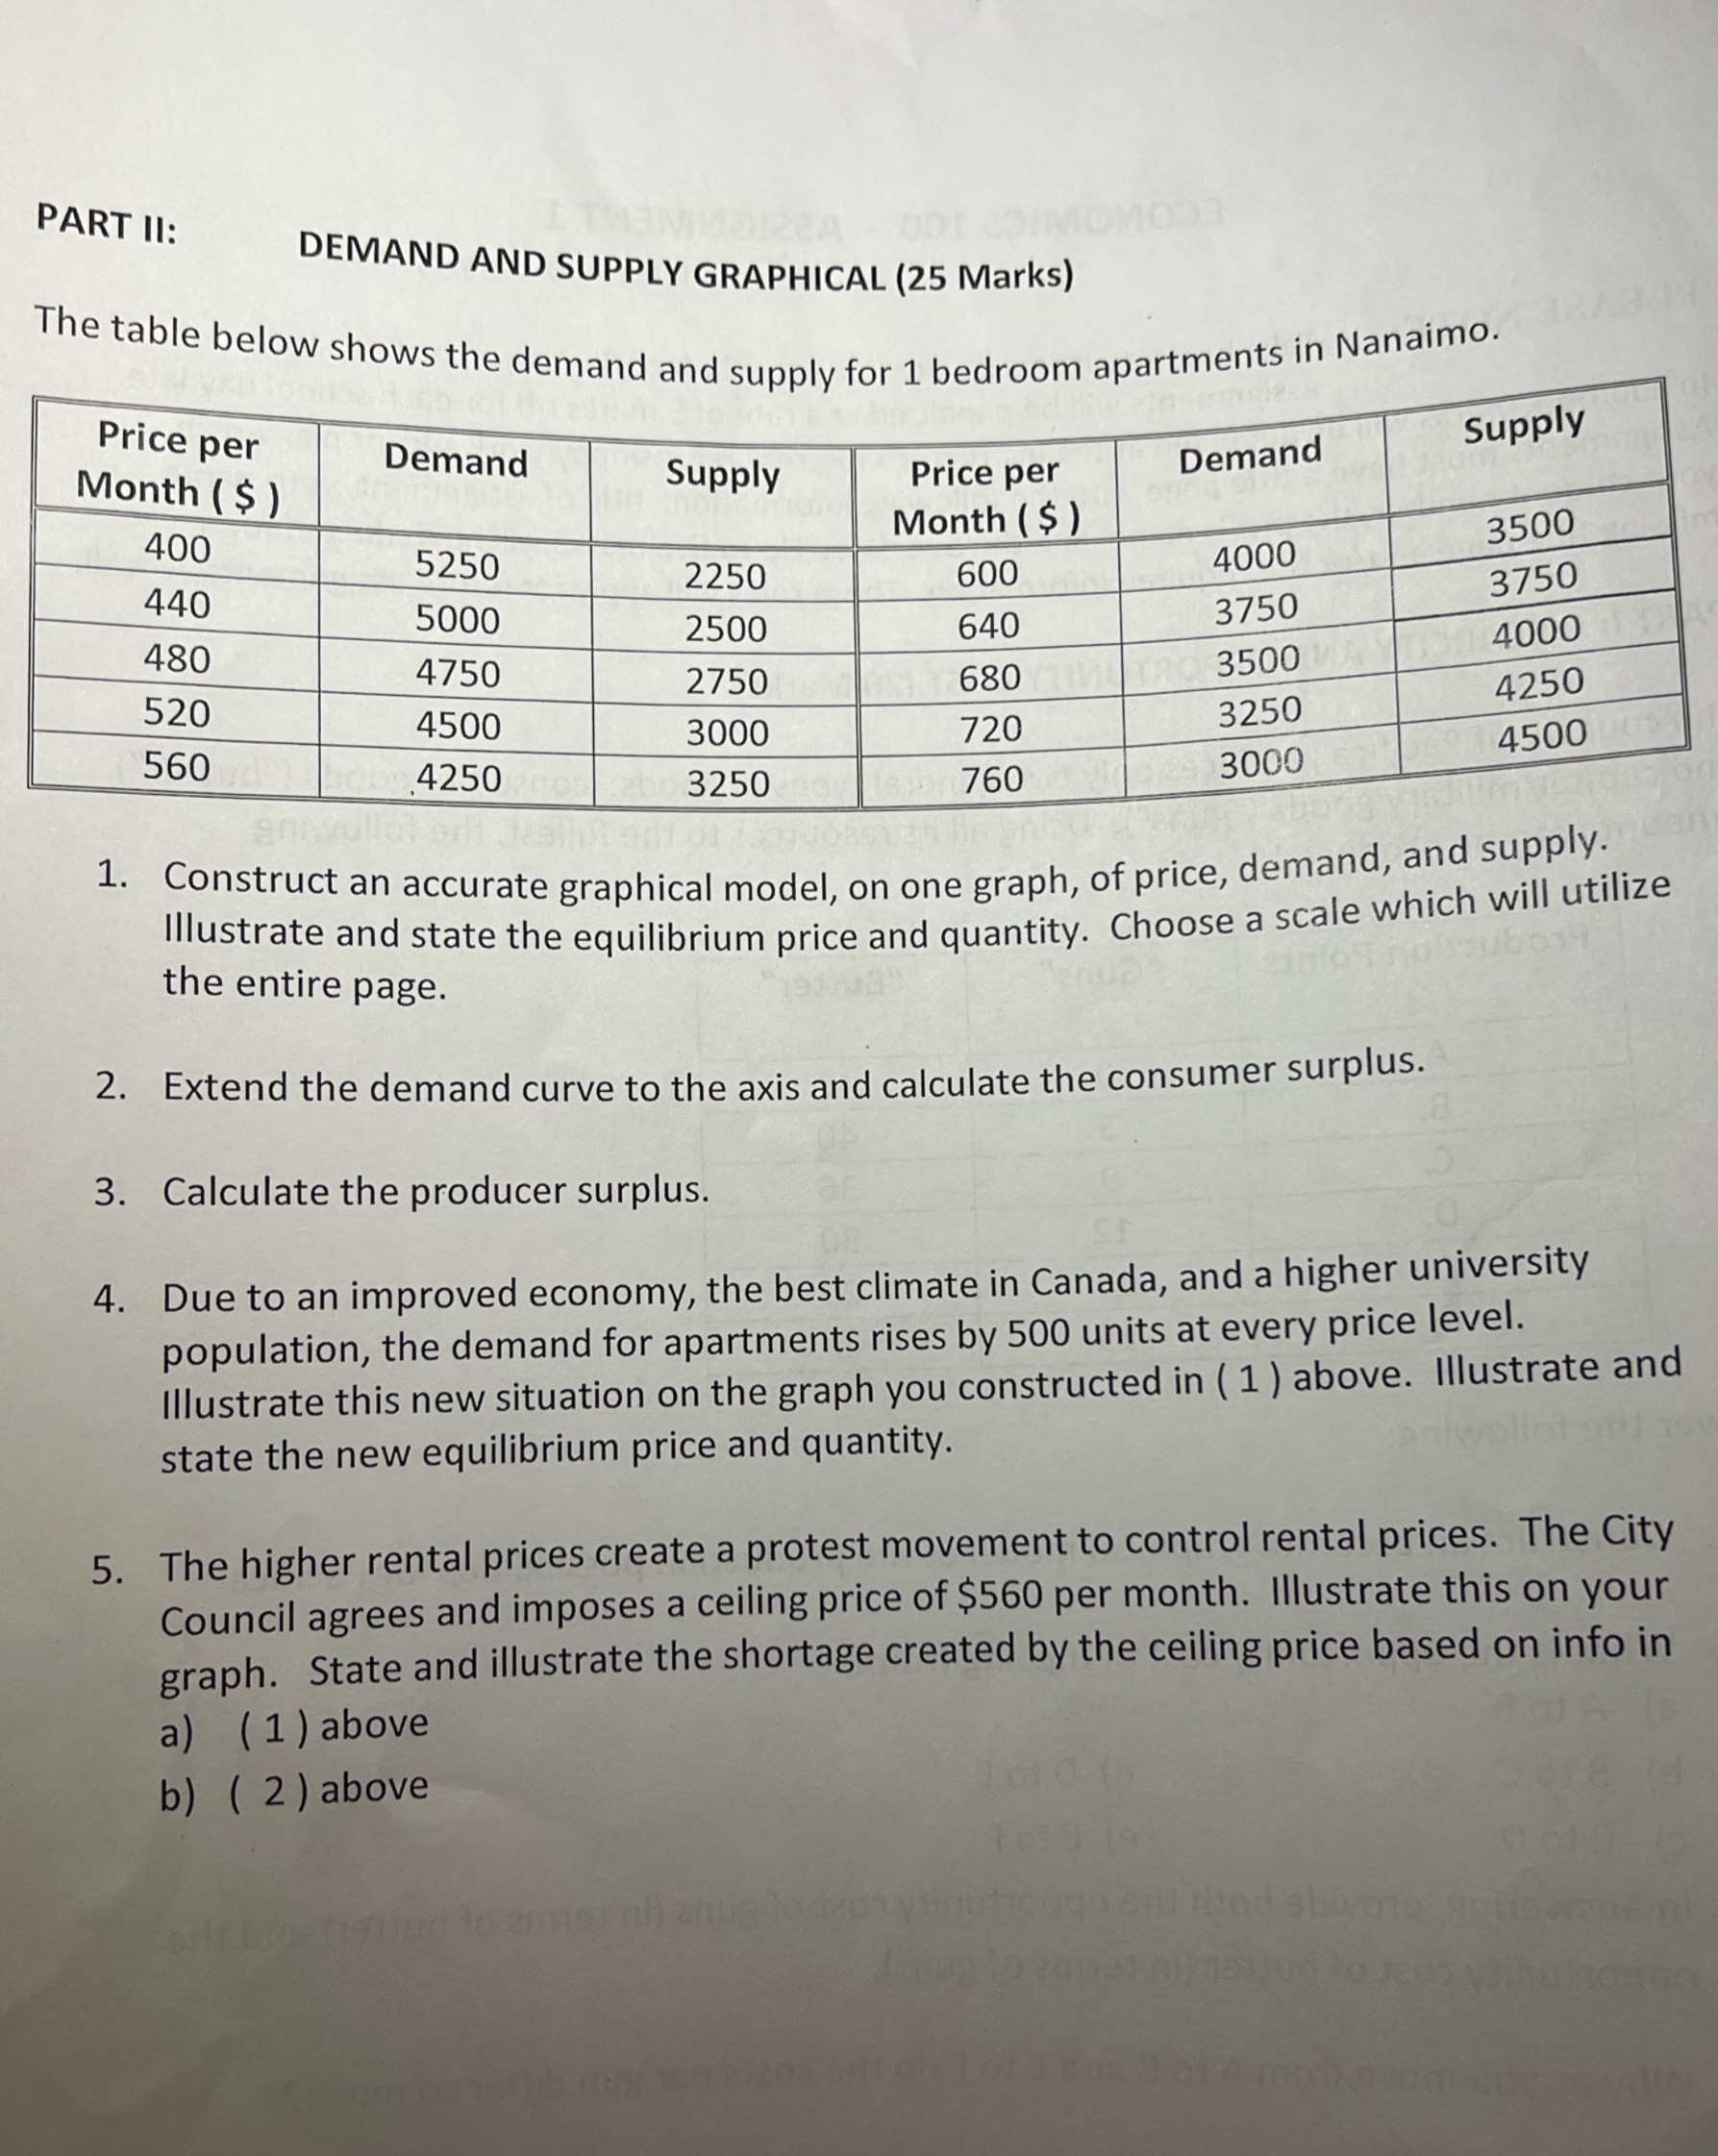
PART II: DEMAND AND SUPPLY GRAPHICAL (25 Marks) The table below shows the demand and supply for 1 bedroom apartments in Nanaimo. Price per Supply Month ( $ ) Demand Supply Price per Demand 400 Month ( $ ) 5250 3500 2250 600 4000 440 5000 3750 480 2500 640 3750 4750 4000 2750 680 3500 520 4500 4250 3000 720 3250 560 4250 4500 3250 760 3000 1. Construct an accurate graphical model, on one graph, of price, demand, and supply. Illustrate and state the equilibrium price and quantity. Choose a scale which will utilize the entire page. 2. Extend the demand curve to the axis and calculate the consumer surplus. 3. Calculate the producer surplus. 4. Due to an improved economy, the best climate in Canada, and a higher university population, the demand for apartments rises by 500 units at every price level. Illustrate this new situation on the graph you constructed in ( 1 ) above. Illustrate and state the new equilibrium price and quantity. 5. The higher rental prices create a protest movement to control rental prices. The City Council agrees and imposes a ceiling price of $560 per month. Illustrate this on your graph. State and illustrate the shortage created by the ceiling price based on info in a) ( 1 ) above b) ( 2 ) above
Step by Step Solution
There are 3 Steps involved in it

Get step-by-step solutions from verified subject matter experts