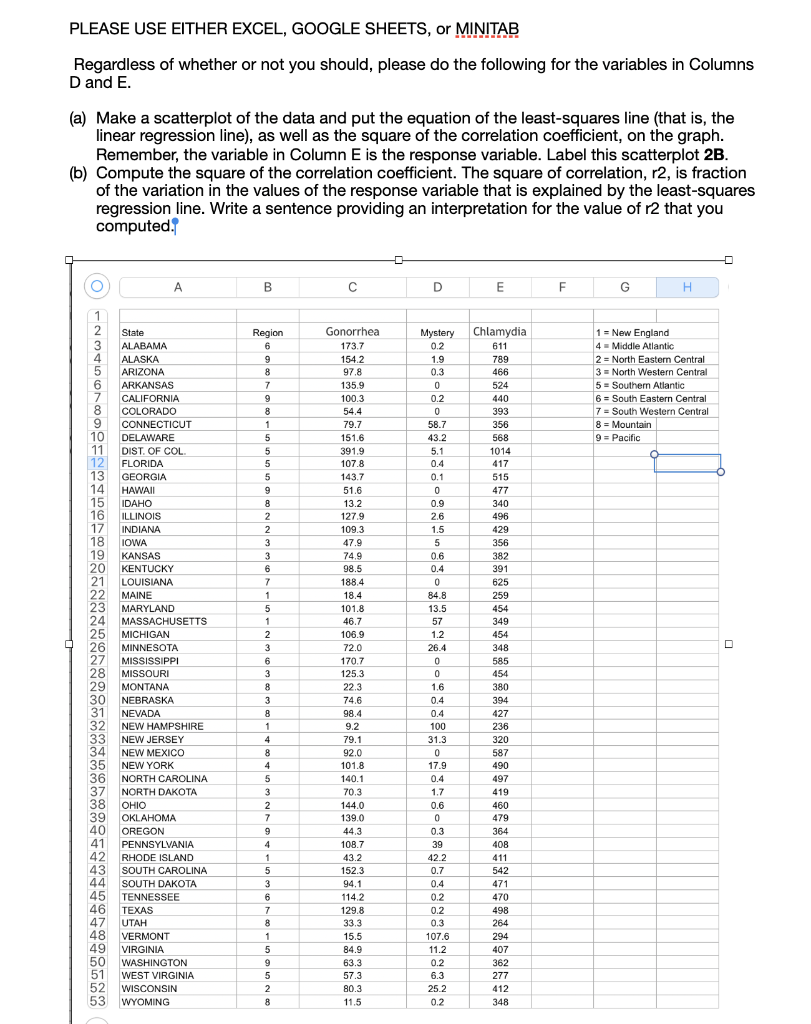
Question: PLEASE USE EITHER EXCEL, GOOGLE SHEETS, or MINITAB Regardless of whether or not you should, please do the following for the variables in Columns D

PLEASE USE EITHER EXCEL, GOOGLE SHEETS, or

PLEASE USE EITHER EXCEL, GOOGLE SHEETS, or MINITAB Regardless of whether or not you should, please do the following for the variables in Columns D and E. (a) Make a scatterplot of the data and put the equation of the least-squares line (that is, the linear regression line), as well as the square of the correlation coefficient, on the graph. Remember, the variable in Column E is the response variable. Label this scatterplot 2B. (b) Compute the square of the correlation coefficient. The square of correlation, r2, is fraction of the variation in the values of the response variable that is explained by the least-squares regression line. Write a sentence providing an interpretation for the value of r2 that you computed. A B D E F G H Region 6 9 8 7 1 = New England 4 = Middle Atlantic 2 = North Eastern Central 3 = North Western Central 5 = Southern Atlantic 6 = South Eastern Central 7 = South Western Central 8 = Mountain 9 = Pacific 9 8 1 5 5 5 a 5 9 8 2 2 3 3 6 7 1 5 1 2 1 2 State 3 ALABAMA 4 ALASKA 5 ARIZONA 6 ARKANSAS 7 CALIFORNIA 8 COLORADO 9 CONNECTICUT 10 DELAWARE 11 DIST. OF COL 12 FLORIDA 13 GEORGIA 14 HAWAII 15 IDAHO 16 ILLINOIS 17 INDIANA 18 IOWA 19 KANSAS 20 KENTUCKY 21 LOUISIANA 22 MAINE 23 MARYLAND 24 MASSACHUSETTS 25 MICHIGAN 26 MINNESOTA 27 MISSISSIPPI 28 MISSOURI 29 MONTANA 30 NEBRASKA 31 NEVADA 32 NEW HAMPSHIRE 33 NEW JERSEY 34 NEW MEXICO 35 NEW YORK 36 NORTH CAROLINA 37 NORTH DAKOTA 38 OHIO 39 OKLAHOMA 40 OREGON 41 PENNSYLVANIA 42 RHODE ISLAND 43 SOUTH CAROLINA 44 SOUTH DAKOTA 45 TENNESSEE 46 TEXAS 47 UTAH 48 VERMONT 49 VIRGINIA 50 WASHINGTON 51 WEST VIRGINIA 52 WISCONSIN 53 WYOMING 3 6 Gonorrhea 173.7 154.2 97.8 135.9 100.3 54.4 79.7 151.6 391.9 107.8 143.7 51.6 13.2 127.9 109.3 47.9 74.9 98.5 188.4 18.4 101.8 46.7 106.9 72.0 170.7 125.3 22.3 74.6 98.4 9.2 79.1 92.0 101.8 140.1 70.3 144.0 139.0 44.3 108.7 43.2 152.3 94.1 114.2 129.8 33.3 15.5 84.9 63.3 57.3 80.3 11.5 Mystery 0.2 1.9 0.3 0 0 0.2 0 58.7 43.2 5.1 0.4 0.1 0 0.9 2.6 1.5 5 5 0.6 0.4 0 0 84.8 13.5 57 1.2 26.4 0 0 1.6 0.4 0.4 100 31.3 0 17.9 0.4 1.7 0.6 0 0.3 39 42.2 0.7 0.4 0.2 0.2 0.3 107.6 11.2 0.2 6.3 25.2 0.2 Chlamydia 611 789 466 524 440 393 356 568 1014 417 515 477 340 496 429 356 382 391 625 259 454 349 454 348 585 454 380 394 427 236 320 587 490 497 419 460 479 364 408 411 542 471 470 498 264 294 407 362 277 412 348 8 3 8 1 8 8 4 5 3 2 7 9 4 1 5 3 6 7 8 1 5 9 5 2 8 PLEASE USE EITHER EXCEL, GOOGLE SHEETS, or MINITAB Regardless of whether or not you should, please do the following for the variables in Columns D and E. (a) Make a scatterplot of the data and put the equation of the least-squares line (that is, the linear regression line), as well as the square of the correlation coefficient, on the graph. Remember, the variable in Column E is the response variable. Label this scatterplot 2B. (b) Compute the square of the correlation coefficient. The square of correlation, r2, is fraction of the variation in the values of the response variable that is explained by the least-squares regression line. Write a sentence providing an interpretation for the value of r2 that you computed. A B D E F G H Region 6 9 8 7 1 = New England 4 = Middle Atlantic 2 = North Eastern Central 3 = North Western Central 5 = Southern Atlantic 6 = South Eastern Central 7 = South Western Central 8 = Mountain 9 = Pacific 9 8 1 5 5 5 a 5 9 8 2 2 3 3 6 7 1 5 1 2 1 2 State 3 ALABAMA 4 ALASKA 5 ARIZONA 6 ARKANSAS 7 CALIFORNIA 8 COLORADO 9 CONNECTICUT 10 DELAWARE 11 DIST. OF COL 12 FLORIDA 13 GEORGIA 14 HAWAII 15 IDAHO 16 ILLINOIS 17 INDIANA 18 IOWA 19 KANSAS 20 KENTUCKY 21 LOUISIANA 22 MAINE 23 MARYLAND 24 MASSACHUSETTS 25 MICHIGAN 26 MINNESOTA 27 MISSISSIPPI 28 MISSOURI 29 MONTANA 30 NEBRASKA 31 NEVADA 32 NEW HAMPSHIRE 33 NEW JERSEY 34 NEW MEXICO 35 NEW YORK 36 NORTH CAROLINA 37 NORTH DAKOTA 38 OHIO 39 OKLAHOMA 40 OREGON 41 PENNSYLVANIA 42 RHODE ISLAND 43 SOUTH CAROLINA 44 SOUTH DAKOTA 45 TENNESSEE 46 TEXAS 47 UTAH 48 VERMONT 49 VIRGINIA 50 WASHINGTON 51 WEST VIRGINIA 52 WISCONSIN 53 WYOMING 3 6 Gonorrhea 173.7 154.2 97.8 135.9 100.3 54.4 79.7 151.6 391.9 107.8 143.7 51.6 13.2 127.9 109.3 47.9 74.9 98.5 188.4 18.4 101.8 46.7 106.9 72.0 170.7 125.3 22.3 74.6 98.4 9.2 79.1 92.0 101.8 140.1 70.3 144.0 139.0 44.3 108.7 43.2 152.3 94.1 114.2 129.8 33.3 15.5 84.9 63.3 57.3 80.3 11.5 Mystery 0.2 1.9 0.3 0 0 0.2 0 58.7 43.2 5.1 0.4 0.1 0 0.9 2.6 1.5 5 5 0.6 0.4 0 0 84.8 13.5 57 1.2 26.4 0 0 1.6 0.4 0.4 100 31.3 0 17.9 0.4 1.7 0.6 0 0.3 39 42.2 0.7 0.4 0.2 0.2 0.3 107.6 11.2 0.2 6.3 25.2 0.2 Chlamydia 611 789 466 524 440 393 356 568 1014 417 515 477 340 496 429 356 382 391 625 259 454 349 454 348 585 454 380 394 427 236 320 587 490 497 419 460 479 364 408 411 542 471 470 498 264 294 407 362 277 412 348 8 3 8 1 8 8 4 5 3 2 7 9 4 1 5 3 6 7 8 1 5 9 5 2 8

Step by Step Solution

There are 3 Steps involved in it

1 Expert Approved Answer
Step: 1 Unlock blur-text-image
Question Has Been Solved by an Expert!

Get step-by-step solutions from verified subject matter experts

Step: 2 Unlock
Step: 3 Unlock

Students Have Also Explored These Related General Management Questions!