

Question: please use Excel and explain how to create the charts 5-1. The data shown here are and R values for 24 samples of size 5
please use Excel and explain how to create the charts 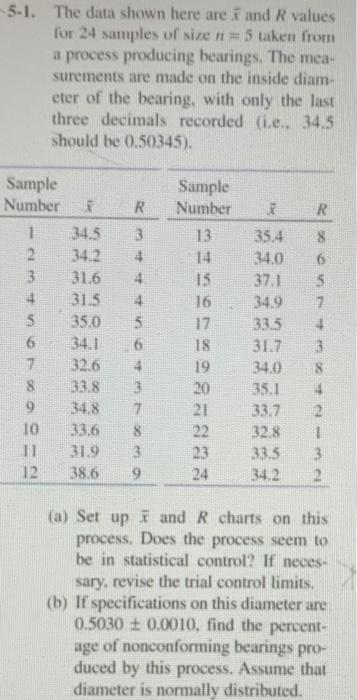
5-1. The data shown here are and R values for 24 samples of size 5 taken from a process producing bearings. The mea- surements are made on the inside diam- eter of the bearing, with only the last three decimals recorded (ie. 34.5 should be 0.50345). Sample Number 2 R R 8 1 12 3 3 4 4 4 5 6 5 6 7 8 9 TO 11 12 34.5 3422 31.6 31.5 35.0 34.1 32.6 33.8 34.8 33.6 31.9 38.6 Sample Number 13 14 15 16 17 18 19 20 21 22 23 24 35.4 34,0 37.1 34.9 133.5 31.7 134.0 35.1 33.7 32.8 33,3 34.2 8 6 3 7 4 3 8 4 12 1 3 2 3 7 8 13 9 (a) Set up and R charts on this process. Does the process seem to be in statistical control? If neces. sary, revise the trial control limits. (b) If specifications on this diameter are 0.5030 +0,0010, find the percent- age of nonconforming bearings pro- duced by this process. Assume that diameter is normally distributed
Step by Step Solution
There are 3 Steps involved in it
1 Expert Approved Answer
Step: 1 Unlock

Question Has Been Solved by an Expert!
Get step-by-step solutions from verified subject matter experts
Step: 2 Unlock
Step: 3 Unlock